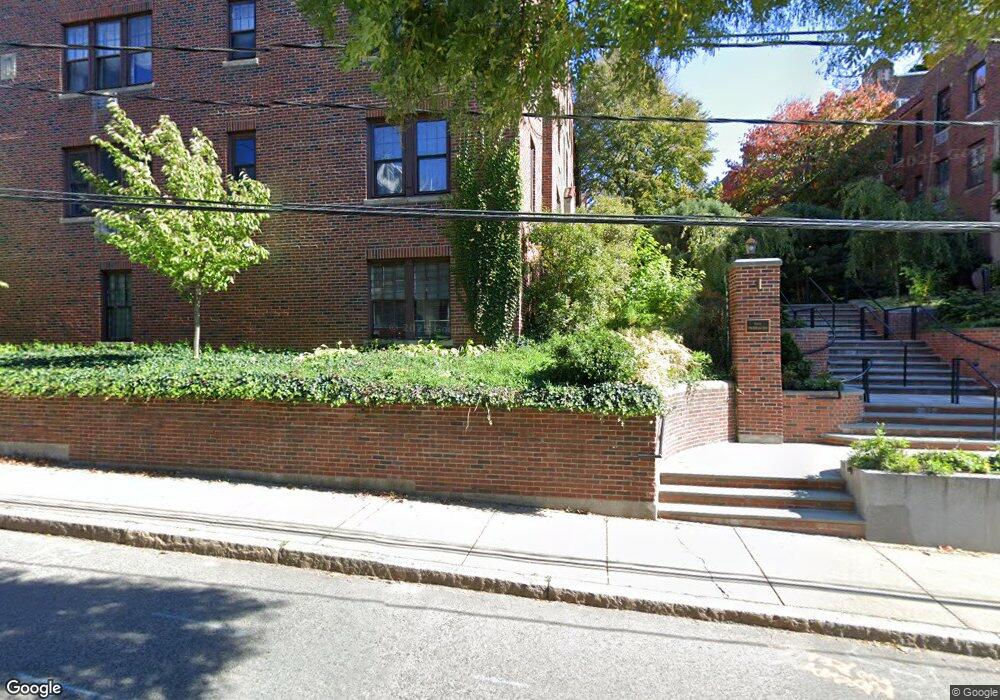
317 Tappan St Unit 2 Brookline, MA 02445
Washington Square NeighborhoodEstimated Value: $866,159 - $944,000
2
Beds
2
Baths
1,124
Sq Ft
$801/Sq Ft
Est. Value
About This Home
This home is located at 317 Tappan St Unit 2, Brookline, MA 02445 and is currently estimated at $900,790, approximately $801 per square foot. 317 Tappan St Unit 2 is a home located in Norfolk County with nearby schools including John D. Runkle School, Torah Academy, and Maimonides School.
Ownership History
Date
Name
Owned For
Owner Type
Purchase Details
Closed on
Jul 5, 2000
Sold by
Mcjohn Stephen M
Bought by
Berman Erik
Current Estimated Value
Home Financials for this Owner
Home Financials are based on the most recent Mortgage that was taken out on this home.
Original Mortgage
$252,000
Interest Rate
8.55%
Mortgage Type
Purchase Money Mortgage
Purchase Details
Closed on
Oct 21, 1997
Sold by
Josephson Susan M
Bought by
Mcjohn Stephen M
Home Financials for this Owner
Home Financials are based on the most recent Mortgage that was taken out on this home.
Original Mortgage
$163,200
Interest Rate
7.46%
Mortgage Type
Purchase Money Mortgage
Purchase Details
Closed on
Sep 2, 1994
Sold by
Tappan St Rt
Bought by
Josephson Susan M
Purchase Details
Closed on
Jun 8, 1987
Sold by
Donnelly Ann M
Bought by
Erlich Frada
Create a Home Valuation Report for This Property
The Home Valuation Report is an in-depth analysis detailing your home's value as well as a comparison with similar homes in the area
Home Values in the Area
Average Home Value in this Area
Purchase History
| Date | Buyer | Sale Price | Title Company |
|---|---|---|---|
| Berman Erik | $304,500 | -- | |
| Mcjohn Stephen M | $204,000 | -- | |
| Josephson Susan M | $172,000 | -- | |
| Erlich Frada | $179,000 | -- |
Source: Public Records
Mortgage History
| Date | Status | Borrower | Loan Amount |
|---|---|---|---|
| Open | Erlich Frada | $252,000 | |
| Closed | Erlich Frada | $252,000 | |
| Previous Owner | Erlich Frada | $163,200 | |
| Previous Owner | Erlich Frada | $163,200 |
Source: Public Records
Tax History Compared to Growth
Tax History
| Year | Tax Paid | Tax Assessment Tax Assessment Total Assessment is a certain percentage of the fair market value that is determined by local assessors to be the total taxable value of land and additions on the property. | Land | Improvement |
|---|---|---|---|---|
| 2025 | $7,787 | $789,000 | $0 | $789,000 |
| 2024 | $7,557 | $773,500 | $0 | $773,500 |
| 2023 | $7,539 | $756,200 | $0 | $756,200 |
| 2022 | $7,555 | $741,400 | $0 | $741,400 |
| 2021 | $7,194 | $734,100 | $0 | $734,100 |
| 2020 | $6,869 | $726,900 | $0 | $726,900 |
| 2019 | $6,487 | $692,300 | $0 | $692,300 |
| 2018 | $6,142 | $649,300 | $0 | $649,300 |
| 2017 | $5,940 | $601,200 | $0 | $601,200 |
| 2016 | $5,696 | $546,600 | $0 | $546,600 |
| 2015 | $5,307 | $496,900 | $0 | $496,900 |
| 2014 | $5,146 | $451,800 | $0 | $451,800 |
Source: Public Records
Map
Nearby Homes
- 184 Rawson Rd
- 255 Tappan St
- 324 Tappan St Unit 1
- 324 Tappan St Unit 2
- 94 Beaconsfield Rd Unit 201
- 16 Garrison Rd Unit 7
- 90 Addington Rd Unit 1
- 1731 Beacon St Unit 717
- 1731 Beacon St Unit 1502
- 135 Beaconsfield Rd Unit 1
- 333 Clark Rd
- 141 Beaconsfield Rd Unit 6
- 57 University Rd Unit 3
- 108-116 Winthrop Rd
- 15 Colbourne Crescent Unit 2
- 12 Colbourne Crescent Unit 1
- 1763 Beacon St Unit A
- 84 Winthrop Rd Unit 1
- 84 Winthrop Rd
- 648 Washington St Unit 7
- 317 Tappan St Unit 6
- 317 Tappan St Unit 5
- 317 Tappan St Unit 4
- 317 Tappan St Unit 3
- 317 Tappan St Unit 1
- 317 Tappan St Unit B
- 317 Tappan St
- 313 Tappan St Unit 6
- 313 Tappan St Unit 5
- 313 Tappan St Unit 4
- 313 Tappan St Unit 3
- 313 Tappan St Unit 2
- 313 Tappan St Unit 1
- 313 Tappan St
- 313 Tappan St Unit Tappan St
- 313 Tappan St Unit 6, 313
- 323 Tappan St Unit 6
- 323 Tappan St Unit 5
- 323 Tappan St Unit 4
- 323 Tappan St Unit 3