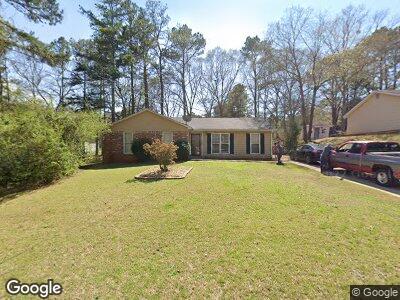
317 Woodland Dr Lagrange, GA 30241
Estimated Value: $181,000 - $197,000
3
Beds
2
Baths
1,248
Sq Ft
$151/Sq Ft
Est. Value
About This Home
This home is located at 317 Woodland Dr, Lagrange, GA 30241 and is currently estimated at $188,357, approximately $150 per square foot. 317 Woodland Dr is a home located in Troup County with nearby schools including Franklin Forest Elementary School, Hollis Hand Elementary School, and Ethel W. Kight Elementary School.
Ownership History
Date
Name
Owned For
Owner Type
Purchase Details
Closed on
Feb 10, 2012
Sold by
Morgan Valerie A
Bought by
Strickland Ruben L
Current Estimated Value
Purchase Details
Closed on
Oct 11, 1999
Sold by
Teresa A Whitney
Bought by
Hancock Johnny and Hancock Linda
Purchase Details
Closed on
Nov 26, 1997
Sold by
Kimbrough Middleton R and Kimbrough Ta
Bought by
Teresa A Whitney
Purchase Details
Closed on
May 4, 1988
Sold by
Martin G Talley
Bought by
Kimbrough Middleton R and Kimbrough Ta
Purchase Details
Closed on
Jan 1, 1988
Sold by
Gwen Martin and Gwen Talley
Bought by
Martin G Talley
Purchase Details
Closed on
Feb 1, 1983
Sold by
Jerry Averett Inc
Bought by
Gwen Martin and Gwen Talley
Purchase Details
Closed on
Nov 1, 1982
Bought by
Jerry Averett Inc
Purchase Details
Closed on
Mar 9, 1976
Create a Home Valuation Report for This Property
The Home Valuation Report is an in-depth analysis detailing your home's value as well as a comparison with similar homes in the area
Home Values in the Area
Average Home Value in this Area
Purchase History
| Date | Buyer | Sale Price | Title Company |
|---|---|---|---|
| Strickland Ruben L | $45,000 | -- | |
| Strickland Ruben L | $45,000 | -- | |
| Hancock Johnny | $72,000 | -- | |
| Teresa A Whitney | $68,000 | -- | |
| Kimbrough Middleton R | $54,300 | -- | |
| Martin G Talley | -- | -- | |
| Gwen Martin | -- | -- | |
| Jerry Averett Inc | -- | -- | |
| -- | -- | -- |
Source: Public Records
Mortgage History
| Date | Status | Borrower | Loan Amount |
|---|---|---|---|
| Previous Owner | Morgan Valerie A | $62,840 | |
| Previous Owner | Hancock Johnny | $100,000 |
Source: Public Records
Tax History Compared to Growth
Tax History
| Year | Tax Paid | Tax Assessment Tax Assessment Total Assessment is a certain percentage of the fair market value that is determined by local assessors to be the total taxable value of land and additions on the property. | Land | Improvement |
|---|---|---|---|---|
| 2024 | $1,661 | $60,920 | $10,000 | $50,920 |
| 2023 | $1,486 | $54,480 | $10,000 | $44,480 |
| 2022 | $1,243 | $44,520 | $8,000 | $36,520 |
| 2021 | $999 | $33,120 | $6,000 | $27,120 |
| 2020 | $999 | $33,120 | $6,000 | $27,120 |
| 2019 | $685 | $22,720 | $7,040 | $15,680 |
| 2018 | $685 | $22,720 | $7,040 | $15,680 |
| 2017 | $685 | $22,720 | $7,040 | $15,680 |
| 2016 | $670 | $22,225 | $7,040 | $15,185 |
| 2015 | $661 | $21,887 | $6,702 | $15,185 |
| 2014 | $638 | $21,088 | $6,702 | $14,386 |
| 2013 | -- | $22,267 | $6,702 | $15,565 |
Source: Public Records
Map
Nearby Homes
- 218 Hearthstone Dr
- 205 Lenox Cir
- 207 Lenox Cir
- 209 Lenox Cir
- 211 Rutland Cir
- 347 Brookridge Dr
- 45 N Cary St
- 405 Sanford Ave
- 405 N Sanford Ave
- 424 Sweetwood Ct
- 417 Sweetwood Ct
- 101 Amy Ave
- 402 Bridgette Blvd
- 125 Celebration Blvd
- 5 Curran Ave
- 112 Celebration Blvd
- 114 Celebration Blvd
- 1206 Pool Mill St
- 21 Barnard Ave
- 103 Ridgefield Cir
- 317 Woodland Dr
- 319 Woodland Dr
- 315 Woodland Dr
- 0 Woodland Dr Unit 7536862
- 0 Woodland Dr Unit 7127240
- 0 Woodland Dr Unit 3111312
- 0 Woodland Dr Unit 8440253
- 0 Woodland Dr Unit 8215337
- 0 Woodland Dr Unit 7594966
- 0 Woodland Dr Unit 7581740
- 0 Woodland Dr Unit 8434965
- 0 Woodland Dr Unit 7300937
- 0 Woodland Dr
- 214 Hearthstone Dr
- 216 Hearthstone Dr
- 212 Hearthstone Dr
- 401 Woodland Dr
- 313 Woodland Dr
- 318 Woodland Dr
- 316 Woodland Dr