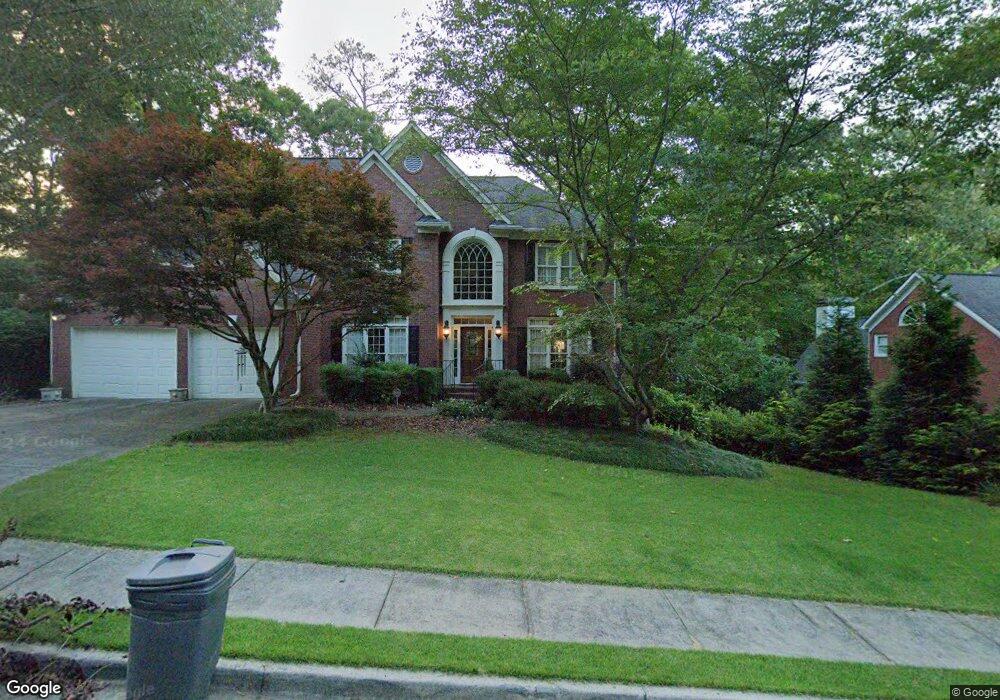
3170 Bywater Trail Unit 6A Roswell, GA 30075
Estimated Value: $867,000 - $982,000
4
Beds
4
Baths
3,544
Sq Ft
$260/Sq Ft
Est. Value
About This Home
This home is located at 3170 Bywater Trail Unit 6A, Roswell, GA 30075 and is currently estimated at $920,650, approximately $259 per square foot. 3170 Bywater Trail Unit 6A is a home located in Fulton County with nearby schools including Roswell North Elementary School, Crabapple Middle School, and St Francis Day School.
Ownership History
Date
Name
Owned For
Owner Type
Purchase Details
Closed on
Mar 26, 2004
Sold by
Farley Timothy J and Farley Mary C
Bought by
Beatty Daniel and Beatty Jennifer
Current Estimated Value
Home Financials for this Owner
Home Financials are based on the most recent Mortgage that was taken out on this home.
Original Mortgage
$333,700
Interest Rate
5.53%
Mortgage Type
New Conventional
Purchase Details
Closed on
Jul 2, 1998
Sold by
Wilkerson Kirk A
Bought by
Farley Timothy J and Farley Mary C
Home Financials for this Owner
Home Financials are based on the most recent Mortgage that was taken out on this home.
Original Mortgage
$260,000
Interest Rate
6.94%
Mortgage Type
New Conventional
Purchase Details
Closed on
May 27, 1994
Sold by
Wieland John Homes Inc
Bought by
Wade Jonathan J Leslie
Home Financials for this Owner
Home Financials are based on the most recent Mortgage that was taken out on this home.
Original Mortgage
$284,400
Interest Rate
6.75%
Create a Home Valuation Report for This Property
The Home Valuation Report is an in-depth analysis detailing your home's value as well as a comparison with similar homes in the area
Home Values in the Area
Average Home Value in this Area
Purchase History
| Date | Buyer | Sale Price | Title Company |
|---|---|---|---|
| Beatty Daniel | $423,000 | -- | |
| Farley Timothy J | $360,000 | -- | |
| Wade Jonathan J Leslie | $299,500 | -- |
Source: Public Records
Mortgage History
| Date | Status | Borrower | Loan Amount |
|---|---|---|---|
| Closed | Beatty Daniel | $333,700 | |
| Previous Owner | Farley Timothy J | $260,000 | |
| Previous Owner | Wade Jonathan J Leslie | $284,400 |
Source: Public Records
Tax History Compared to Growth
Tax History
| Year | Tax Paid | Tax Assessment Tax Assessment Total Assessment is a certain percentage of the fair market value that is determined by local assessors to be the total taxable value of land and additions on the property. | Land | Improvement |
|---|---|---|---|---|
| 2025 | $1,260 | $302,200 | $68,320 | $233,880 |
| 2023 | $8,426 | $298,520 | $97,080 | $201,440 |
| 2022 | $5,484 | $260,360 | $54,440 | $205,920 |
| 2021 | $6,492 | $244,320 | $49,560 | $194,760 |
| 2020 | $6,588 | $235,000 | $41,960 | $193,040 |
| 2019 | $1,041 | $230,840 | $41,200 | $189,640 |
| 2018 | $5,741 | $225,440 | $40,240 | $185,200 |
| 2017 | $5,434 | $200,600 | $33,760 | $166,840 |
| 2016 | $5,407 | $200,600 | $33,760 | $166,840 |
| 2015 | $6,521 | $200,600 | $33,760 | $166,840 |
| 2014 | $4,806 | $169,520 | $28,520 | $141,000 |
Source: Public Records
Map
Nearby Homes
- 220 High Branch Way
- 3245 Bywater Trail Unit 6B
- 1731 E Bank Dr
- 2039 Old Forge Way
- 5617 Asheforde Ln
- 1009 Lake Pointe Cir
- The Carrington Plan at Hillandale in Historic Roswell
- The Rocklyn Plan at Hillandale in Historic Roswell
- The Grafton Plan at Hillandale in Historic Roswell
- The Greighton Plan at Hillandale in Historic Roswell
- 3210 Lake Pointe Cir
- 5150 Timber Ridge Rd
- 4035 Connolly Ct
- 5140 Timber Ridge Rd
- 3113 Lake Pointe Cir
- 2255 Rushmore Dr
- 4013 Lake Pointe Cir Unit 4013
- 2066 Old Forge Way
- 1720 Little Willeo Rd
- 3180 Bywater Trail
- 3160 Bywater Trail Unit 6A
- 0 Bywater Trail Unit 8418362
- 0 Bywater Trail Unit 8417463
- 110 Longwater Cove
- 3190 Bywater Trail Unit 6B
- 120 Longwater Cove Unit 6A
- 3165 Bywater Trail
- 0 Willeo Place Unit 7018408
- 3175 Bywater Trail
- 903 Willeo Place
- 3200 Bywater Trail
- 130 Longwater Cove
- 3150 Bywater Trail Unit 6A
- 3185 Bywater Trail Unit 6B
- 900 Willeo Place
- 115 Longwater Cove
- 3195 Bywater Trail
- 240 High Branch Way
- 3210 Bywater Trail Unit 6B