


3170 N Ave Denison, IA 51442
Estimated payment $0/month
About This Home
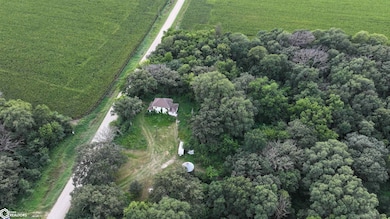
AUCTION! TRACT 1: 77.75 Acres, with house Building Descriptions: Shed 10 x 60 built in 1965, Shed 16 x 12 built in 1992, Wire Grain Bin Legal Description: SW SE, SE SE Section 3-83N-38W Soil Productivity: 79.9 CSR2 Taxes: $3,226 Annual Real Estate TRACT 2: 39 Acres Legal Description: NW NE Section 10-83N-38W Soil Productivity: 73.8 CSR2 Taxes: $1,426 Annual Real Estate Possession Terms: Immediate possession of the house and buildings at closing, and landlord possession of the farm ground at closing. Earnest Deposit: 10% due upon Seller's acceptance of your bid Tenancy: The farm is rented for the 2025 season. *THIS PROPERTY WILL SELL AT AUCTION. THE PRICE SHOWN IS NOT REFLECTIVE OF THE ASKING/SALES PRICE.
Listing Agent
DreamDirt Farm & Ranch Real Estate Brokerage Email: jason@dreamdirt.com Listed on: 08/22/2025
Property Details
Property Type
- Other
Est. Annual Taxes
- $1,884
Year Built
- Built in 1918
Home Design
- Farm
Additional Features
- Basement Fills Entire Space Under The House
- Property is zoned Agriculture
- Forced Air Heating System
Map
Home Values in the Area
Average Home Value in this Area
Tax History
| Year | Tax Paid | Tax Assessment Tax Assessment Total Assessment is a certain percentage of the fair market value that is determined by local assessors to be the total taxable value of land and additions on the property. | Land | Improvement |
|---|---|---|---|---|
| 2025 | $1,884 | $155,460 | $102,190 | $53,270 |
| 2024 | $1,884 | $120,370 | $83,580 | $36,790 |
| 2023 | $1,810 | $120,370 | $83,580 | $36,790 |
| 2022 | $1,770 | $96,200 | $61,170 | $35,030 |
| 2021 | $1,724 | $96,200 | $61,170 | $35,030 |
| 2020 | $1,714 | $92,260 | $59,250 | $33,010 |
| 2019 | $1,694 | $115,260 | $82,980 | $32,280 |
| 2018 | $1,648 | $115,260 | $82,980 | $32,280 |
| 2017 | $1,648 | $115,260 | $82,980 | $32,280 |
| 2016 | $1,598 | $125,610 | $0 | $0 |
| 2015 | $1,598 | $110,210 | $0 | $0 |
| 2014 | $1,364 | $110,210 | $0 | $0 |
Property History
| Date | Event | Price | List to Sale | Price per Sq Ft |
|---|---|---|---|---|
| 10/01/2025 10/01/25 | Pending | -- | -- | -- |
| 08/22/2025 08/22/25 | For Sale | $2 | -- | $0 / Sq Ft |
Source: NoCoast MLS
MLS Number: NOC6331279
APN: 1403400004
Disclaimer: Certain information contained herein is derived from information provided by parties other than Homes.com. All information provided is deemed reliable, but is not guaranteed to be accurate and should be independently verified.
![]() IDX information is provided exclusively for personal, non-commercial use, and may not be used for any purpose other than to identify prospective properties consumers may be interested in purchasing.
IDX information is provided exclusively for personal, non-commercial use, and may not be used for any purpose other than to identify prospective properties consumers may be interested in purchasing.
Information is deemed reliable but not guaranteed.
- 00 L Ave
- 508 3rd Ave
- 2910 Highway 30 E
- Lot 9 Donna Reed Rd
- Lot 2 Donna Reed Rd
- 2411 6th Ave N
- 611 Valley Dr
- 0 S 25th St Unit 6307972
- 0 S 25th St Unit 6307966
- 0 S 25th St Unit 6307968
- 0 S 25th St Unit 6307971
- 0 S 25th St Unit 6307967
- 0 S 25th St Unit 6307970
- 609 N 24th St
- 120 N 24th St
- 1016 Ridge Rd
- 1000 Ridge Rd
- 2301 Frontier Rd
- 2118 9th Ave N
- 615 Sunset Dr
