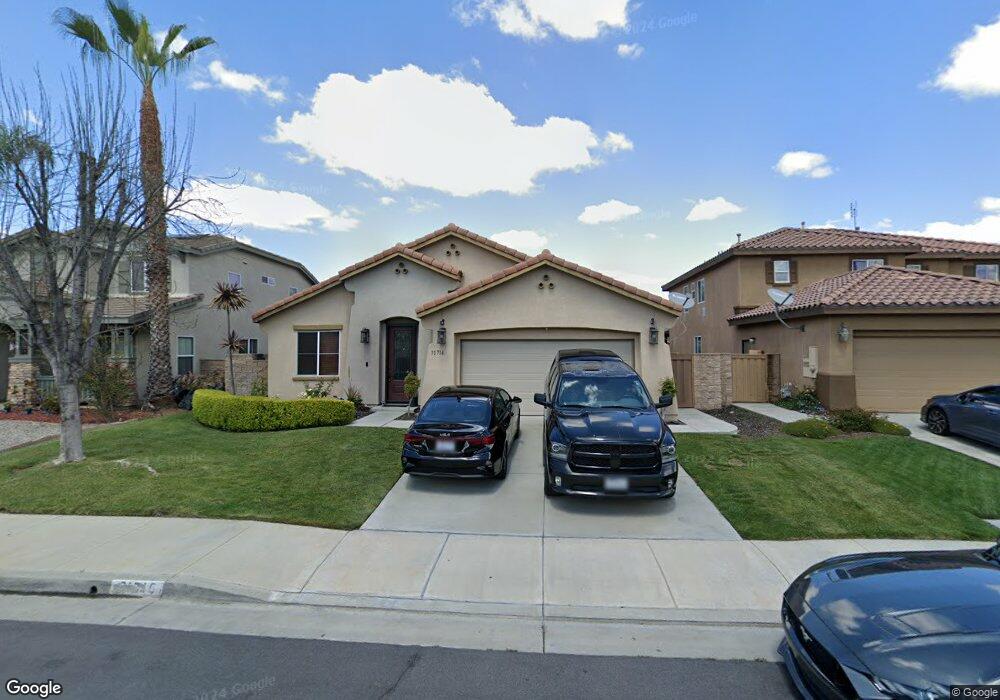
31716 Pompei Ln Winchester, CA 92596
Estimated Value: $571,000 - $598,000
3
Beds
2
Baths
1,864
Sq Ft
$313/Sq Ft
Est. Value
About This Home
This home is located at 31716 Pompei Ln, Winchester, CA 92596 and is currently estimated at $583,857, approximately $313 per square foot. 31716 Pompei Ln is a home located in Riverside County with nearby schools including French Valley Elementary School, Bella Vista Middle School, and Chaparral High School.
Ownership History
Date
Name
Owned For
Owner Type
Purchase Details
Closed on
Apr 8, 2011
Sold by
Haskins Kenneth G
Bought by
Haskins Kenneth G and Kenneth G Haskins Trust
Current Estimated Value
Purchase Details
Closed on
Feb 11, 2009
Sold by
Deutsche Bank National Trust Company
Bought by
Haskins Kenneth G
Purchase Details
Closed on
Aug 28, 2008
Sold by
Sanders Jack R
Bought by
Deutsche Bank National Trust Co and Hsbc Bank Usa Inc Hsi Asset Securitizati
Purchase Details
Closed on
Dec 9, 2005
Sold by
Sanders Jack
Bought by
Alacrity Investments Llc
Purchase Details
Closed on
Aug 30, 2005
Sold by
Kb Home Coastal Inc
Bought by
Sanders Jack
Home Financials for this Owner
Home Financials are based on the most recent Mortgage that was taken out on this home.
Original Mortgage
$318,792
Interest Rate
6%
Mortgage Type
Purchase Money Mortgage
Create a Home Valuation Report for This Property
The Home Valuation Report is an in-depth analysis detailing your home's value as well as a comparison with similar homes in the area
Home Values in the Area
Average Home Value in this Area
Purchase History
| Date | Buyer | Sale Price | Title Company |
|---|---|---|---|
| Haskins Kenneth G | -- | None Available | |
| Haskins Kenneth G | $172,000 | Ticor Title | |
| Deutsche Bank National Trust Co | $147,989 | None Available | |
| Alacrity Investments Llc | -- | First American Title Company | |
| Sanders Jack | $398,500 | First American Title Company |
Source: Public Records
Mortgage History
| Date | Status | Borrower | Loan Amount |
|---|---|---|---|
| Previous Owner | Sanders Jack | $318,792 |
Source: Public Records
Tax History Compared to Growth
Tax History
| Year | Tax Paid | Tax Assessment Tax Assessment Total Assessment is a certain percentage of the fair market value that is determined by local assessors to be the total taxable value of land and additions on the property. | Land | Improvement |
|---|---|---|---|---|
| 2025 | $4,715 | $221,474 | $90,134 | $131,340 |
| 2023 | $4,715 | $212,876 | $86,635 | $126,241 |
| 2022 | $4,614 | $208,703 | $84,937 | $123,766 |
| 2021 | $4,554 | $204,612 | $83,272 | $121,340 |
| 2020 | $4,507 | $202,515 | $82,419 | $120,096 |
| 2019 | $4,367 | $198,545 | $80,803 | $117,742 |
| 2018 | $4,207 | $194,653 | $79,219 | $115,434 |
| 2017 | $4,170 | $190,837 | $77,666 | $113,171 |
| 2016 | $4,127 | $187,096 | $76,144 | $110,952 |
| 2015 | $4,090 | $184,288 | $75,001 | $109,287 |
| 2014 | $4,032 | $180,681 | $73,533 | $107,148 |
Source: Public Records
Map
Nearby Homes
- 31556 Umbria Ln
- 31796 Gimbal Way
- 36358 Matino Ln
- 31771 Biagio Way
- 31759 Delfina Way
- 36315 Antoinette Ln
- 31572 Adour Way
- 36355 Amerigo Ln
- 36316 Cosimo Ln
- 36362 Arcs St
- 36316 Grazia Way Unit 167
- 36320 Grazia Way
- 36415 Flare Dr
- 31809 Delfina Way
- 31556 Vignes Ct
- 31659 Poppy St
- 36423 Rotterdam St
- 31867 Crecy Dr
- 36628 Chantecler Rd
- 31851 Pepper Tree St
- 31728 Pompei Ln
- 31704 Pompei Ln
- 31692 Pompei Ln
- 31740 Pompei Ln
- 36369 Ancona Ct
- 36415 Sicily Ln
- 31680 Pompei Ln
- 36403 Sicily Ln
- 31701 Pompei Ln
- 31725 Pompei Ln
- 36357 Ancona Ct
- 31689 Pompei Ln
- 36354 Ancona Ct
- 31737 Pompei Ln
- 31668 Pompei Ln
- 36379 Sicily Ln
- 31677 Pompei Ln
- 36424 Sicily Ln
- 36436 Sicily Ln
- 31665 Pompei Ln