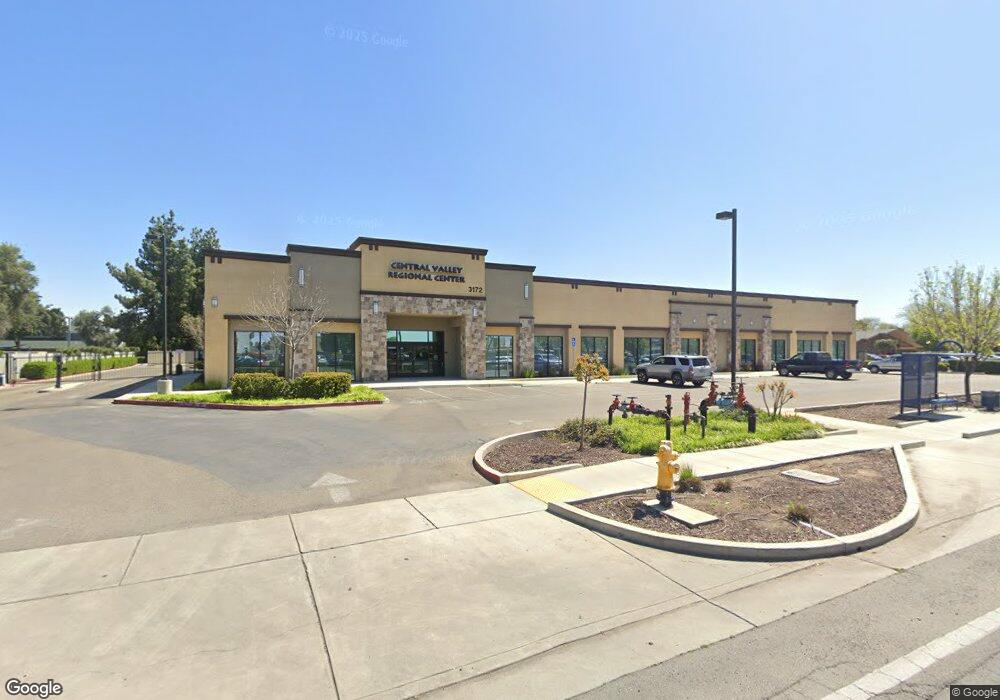
3172 M St Merced, CA 95348
North Merced NeighborhoodEstimated Value: $10,284,697
Studio
--
Bath
--
Sq Ft
69,696
Sq Ft
About This Home
This home is located at 3172 M St, Merced, CA 95348 and is currently estimated at $10,284,697. 3172 M St is a home located in Merced County with nearby schools including Luther Burbank Elementary School, Herbert H. Cruickshank Middle School, and Merced High School.
Ownership History
Date
Name
Owned For
Owner Type
Purchase Details
Closed on
Jun 13, 2017
Sold by
Cvrc North Llc
Bought by
3172 Cvrc Inc
Current Estimated Value
Home Financials for this Owner
Home Financials are based on the most recent Mortgage that was taken out on this home.
Original Mortgage
$3,000,000
Outstanding Balance
$2,489,377
Interest Rate
4.02%
Mortgage Type
Commercial
Estimated Equity
$7,795,320
Purchase Details
Closed on
May 9, 2017
Sold by
3172 Cvrc Inc
Bought by
Fresno Supreme Inc
Home Financials for this Owner
Home Financials are based on the most recent Mortgage that was taken out on this home.
Original Mortgage
$3,000,000
Outstanding Balance
$2,489,377
Interest Rate
4.02%
Mortgage Type
Commercial
Estimated Equity
$7,795,320
Purchase Details
Closed on
Oct 23, 2015
Sold by
Puray Meria E
Bought by
Cvrc North Llc
Purchase Details
Closed on
Sep 13, 2011
Sold by
California Teachers Association
Bought by
Puray Merla E
Create a Home Valuation Report for This Property
The Home Valuation Report is an in-depth analysis detailing your home's value as well as a comparison with similar homes in the area
Home Values in the Area
Average Home Value in this Area
Purchase History
| Date | Buyer | Sale Price | Title Company |
|---|---|---|---|
| 3172 Cvrc Inc | -- | Fidelity National Title Buil | |
| Fresno Supreme Inc | $5,900,000 | Fidelity National Title Buil | |
| Cvrc North Llc | $505,000 | Fidelity National Title | |
| Puray Merla E | $327,500 | Fidelity National Title Comp |
Source: Public Records
Mortgage History
| Date | Status | Borrower | Loan Amount |
|---|---|---|---|
| Open | Fresno Supreme Inc | $3,000,000 |
Source: Public Records
Tax History
| Year | Tax Paid | Tax Assessment Tax Assessment Total Assessment is a certain percentage of the fair market value that is determined by local assessors to be the total taxable value of land and additions on the property. | Land | Improvement |
|---|---|---|---|---|
| 2025 | $71,699 | $6,847,452 | $1,131,568 | $5,715,884 |
| 2024 | $71,699 | $6,713,189 | $1,109,381 | $5,603,808 |
| 2023 | $70,702 | $6,581,559 | $1,087,629 | $5,493,930 |
| 2022 | $69,804 | $6,452,509 | $1,066,303 | $5,386,206 |
| 2021 | $69,655 | $6,325,991 | $1,045,396 | $5,280,595 |
| 2020 | $70,235 | $6,261,126 | $1,034,677 | $5,226,449 |
| 2019 | $69,226 | $6,138,360 | $1,014,390 | $5,123,970 |
| 2018 | $63,170 | $6,018,000 | $994,500 | $5,023,500 |
| 2017 | $15,178 | $1,365,100 | $515,100 | $850,000 |
| 2016 | $3,885 | $347,489 | $347,489 | $0 |
| 2015 | $3,824 | $342,270 | $342,270 | $0 |
| 2014 | $3,741 | $335,566 | $335,566 | $0 |
Source: Public Records
Map
Nearby Homes
- 3350 M St Unit 79
- 3350 M St Unit 74
- 3367 M St
- 315 Diane Ct
- 610 Rambler Rd
- 437 Rice Ct
- 3362 San Jacinto Ct
- 2988 Briarwood Ct
- 147 W Alexander Ave
- 3428 De Anza Ave
- 1061 Northwood Dr
- 310 Buena Vista Ct
- 639 W Donna Dr
- 3061 El Capitan Ave
- 3191 El Capitan Ave
- 512 Spalding Ct
- 3216 El Capitan Ave
- 415 Columbia Ave
- 439 E Olive Ave
- 745 W 25th St
- 3181 Collins Dr Unit B
- 3181 Collins Dr
- 3185 M St
- 3190 M St
- 3172 Collins Dr Unit A
- 3172 Collins Dr
- 3170 Collins Dr
- 3174 Collins Dr Unit A
- 3174 Collins Dr
- 3174 Collins Dr Unit B
- 3178 Collins Dr
- 3178 Collins Dr Unit Ste A
- 3180 Collins Dr
- 676 Loughborough Dr
- 676 Loughborough Dr Unit B
- 635 Fairfield Dr
- 3184 Collins Dr
- 645 Fairfield Dr
- 587 Collins Dr Unit 1
- 301 Collins Dr
Your Personal Tour Guide
Ask me questions while you tour the home.