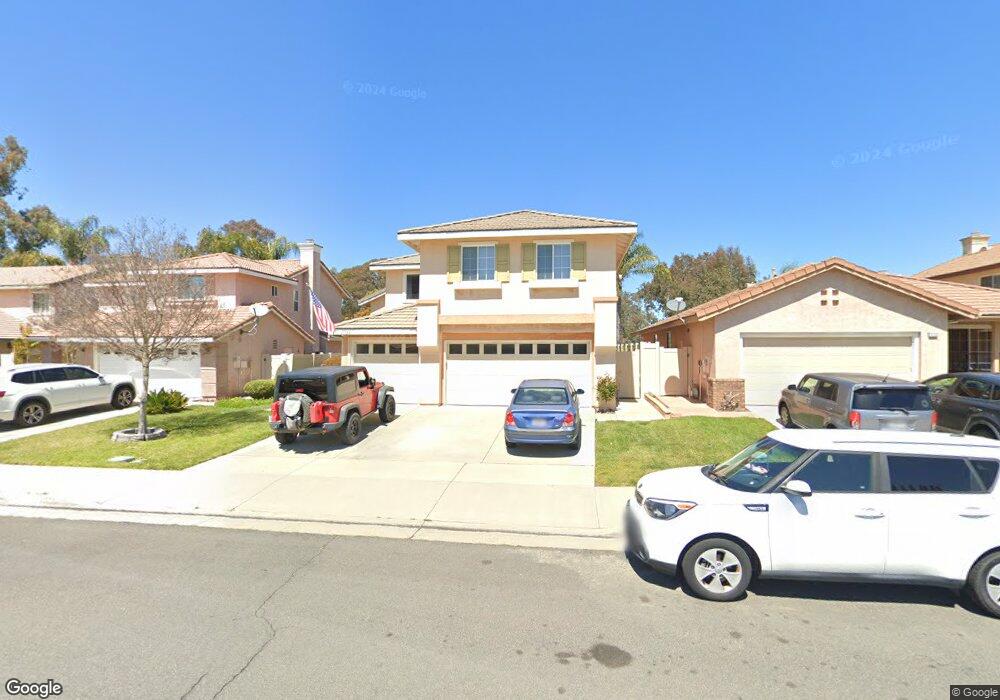
31724 Via San Carlos Temecula, CA 92592
Redhawk NeighborhoodEstimated Value: $773,752 - $873,000
5
Beds
3
Baths
2,765
Sq Ft
$298/Sq Ft
Est. Value
About This Home
This home is located at 31724 Via San Carlos, Temecula, CA 92592 and is currently estimated at $824,438, approximately $298 per square foot. 31724 Via San Carlos is a home located in Riverside County with nearby schools including Red Hawk Elementary, Erle Stanley Gardner Middle School, and Great Oak High School.
Ownership History
Date
Name
Owned For
Owner Type
Purchase Details
Closed on
Jul 27, 2022
Sold by
Garcia Maria D
Bought by
Garcia Maria D
Current Estimated Value
Purchase Details
Closed on
Jul 26, 2022
Sold by
Garcia Maria D
Bought by
Maria Dolores Garcia Living Trust
Purchase Details
Closed on
Aug 3, 1995
Sold by
The Presley Companies
Bought by
Garcia Florencio F and Garcia Maria D
Home Financials for this Owner
Home Financials are based on the most recent Mortgage that was taken out on this home.
Original Mortgage
$130,800
Interest Rate
7.58%
Mortgage Type
Purchase Money Mortgage
Create a Home Valuation Report for This Property
The Home Valuation Report is an in-depth analysis detailing your home's value as well as a comparison with similar homes in the area
Home Values in the Area
Average Home Value in this Area
Purchase History
| Date | Buyer | Sale Price | Title Company |
|---|---|---|---|
| Garcia Maria D | -- | None Listed On Document | |
| Maria Dolores Garcia Living Trust | -- | None Listed On Document | |
| Garcia Florencio F | $186,000 | First American Title Ins Co |
Source: Public Records
Mortgage History
| Date | Status | Borrower | Loan Amount |
|---|---|---|---|
| Previous Owner | Garcia Florencio F | $130,800 |
Source: Public Records
Tax History Compared to Growth
Tax History
| Year | Tax Paid | Tax Assessment Tax Assessment Total Assessment is a certain percentage of the fair market value that is determined by local assessors to be the total taxable value of land and additions on the property. | Land | Improvement |
|---|---|---|---|---|
| 2025 | $3,720 | $308,793 | $49,817 | $258,976 |
| 2023 | $3,720 | $296,805 | $47,884 | $248,921 |
| 2022 | $3,599 | $290,987 | $46,946 | $244,041 |
| 2021 | $3,520 | $285,282 | $46,026 | $239,256 |
| 2020 | $3,472 | $282,358 | $45,555 | $236,803 |
| 2019 | $3,427 | $276,822 | $44,662 | $232,160 |
| 2018 | $3,356 | $271,395 | $43,788 | $227,607 |
| 2017 | $3,294 | $266,075 | $42,930 | $223,145 |
| 2016 | $3,231 | $260,859 | $42,089 | $218,770 |
| 2015 | $3,172 | $256,942 | $41,457 | $215,485 |
| 2014 | $3,074 | $251,911 | $40,646 | $211,265 |
Source: Public Records
Map
Nearby Homes
- 44624 Clover Ln
- 31593 Calle Los Padres
- 45495 Peacock Place
- 45501 Jaguar Way
- 31937 Corte Montoya
- 32122 Corte Eldorado
- 31251 Strawberry Tree Ln
- 31938 Calle Tiara S
- 31941 Calle Tiara S
- 31409 Taylor Ln
- 31191 Mountain Lilac Way
- 44989 Bellflower Ln
- 31186 Lavender Ct Unit 164
- 32315 Via Cordoba
- 44984 Hawthorn St Unit 208
- 31163 Lavender Ct
- 31281 David Ln
- 45723 Pheasant Place
- 45741 Shasta Ln
- 45590 Alpine Place
- 31712 Via San Carlos
- 31732 Via San Carlos
- 31704 Via San Carlos
- 31744 Via San Carlos
- 31752 Via San Carlos
- 31692 Via San Carlos
- 31719 Via San Carlos
- 31707 Via San Carlos
- 31764 Via San Carlos
- 44986 Via Lucia
- 31699 Via San Carlos
- 44989 Via Lucia
- 31772 Via San Carlos
- 44992 Via Lucia
- 31687 Via San Carlos
- 44995 Via Lucia
- 45000 Corte Christina
- 31769 Via San Carlos
- 45006 Corte Christina