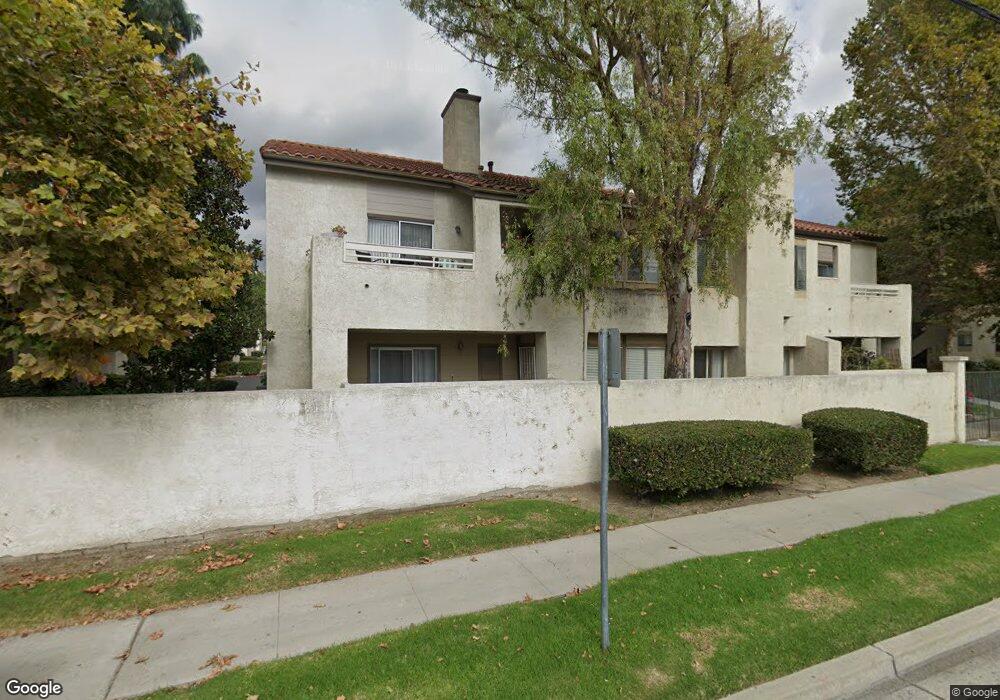
3174 Darby St Unit 106 Simi Valley, CA 93063
Central Simi Valley NeighborhoodEstimated Value: $448,759 - $483,000
2
Beds
1
Bath
1,114
Sq Ft
$415/Sq Ft
Est. Value
About This Home
This home is located at 3174 Darby St Unit 106, Simi Valley, CA 93063 and is currently estimated at $462,190, approximately $414 per square foot. 3174 Darby St Unit 106 is a home located in Ventura County with nearby schools including Sycamore Elementary School, Hillside Middle School, and Simi Valley High School.
Ownership History
Date
Name
Owned For
Owner Type
Purchase Details
Closed on
Oct 1, 2015
Sold by
Lau George J
Bought by
Lau George J and G Lau Living Trust
Current Estimated Value
Purchase Details
Closed on
Sep 16, 2009
Sold by
Lau George J and George J Lau Revocable Trust
Bought by
Lau George J and George J Lau Revocable Trust
Purchase Details
Closed on
Nov 26, 2007
Sold by
Lau George J and The Lau Family Trust
Bought by
Lau George J and The George J Lau Revocable Tru
Purchase Details
Closed on
Nov 29, 2006
Sold by
Lau George J and The Lau Family Trust
Bought by
Lau George J and The Lau Family Trust
Purchase Details
Closed on
May 14, 1995
Sold by
Great Western Bank
Bought by
Lau George J and Lau Mary
Purchase Details
Closed on
Oct 18, 1994
Sold by
Great Western Bank
Bought by
Great Western Bank
Create a Home Valuation Report for This Property
The Home Valuation Report is an in-depth analysis detailing your home's value as well as a comparison with similar homes in the area
Home Values in the Area
Average Home Value in this Area
Purchase History
| Date | Buyer | Sale Price | Title Company |
|---|---|---|---|
| Lau George J | -- | None Available | |
| Lau George J | -- | None Available | |
| Lau George J | -- | None Available | |
| Lau George J | -- | None Available | |
| Lau George J | -- | None Available | |
| Lau George J | -- | None Available | |
| Lau George J | -- | None Available | |
| Lau George J | -- | None Available | |
| Lau George J | $78,500 | Chicago Title Company | |
| Great Western Bank | $87,050 | United Title Company |
Source: Public Records
Tax History Compared to Growth
Tax History
| Year | Tax Paid | Tax Assessment Tax Assessment Total Assessment is a certain percentage of the fair market value that is determined by local assessors to be the total taxable value of land and additions on the property. | Land | Improvement |
|---|---|---|---|---|
| 2025 | $2,103 | $151,125 | $60,445 | $90,680 |
| 2024 | $2,103 | $148,162 | $59,260 | $88,902 |
| 2023 | $1,974 | $145,257 | $58,098 | $87,159 |
| 2022 | $1,947 | $142,409 | $56,959 | $85,450 |
| 2021 | $1,915 | $139,617 | $55,842 | $83,775 |
| 2020 | $1,863 | $138,187 | $55,270 | $82,917 |
| 2019 | $1,769 | $135,479 | $54,187 | $81,292 |
| 2018 | $1,742 | $132,824 | $53,125 | $79,699 |
| 2017 | $1,694 | $130,221 | $52,084 | $78,137 |
| 2016 | $1,614 | $127,668 | $51,063 | $76,605 |
| 2015 | $1,645 | $125,752 | $50,297 | $75,455 |
| 2014 | $1,629 | $123,290 | $49,312 | $73,978 |
Source: Public Records
Map
Nearby Homes
- 3168 Darby St Unit 208
- 3192 Darby St Unit 114
- 3204 Darby St Unit 118
- 3028 Harrison Ln
- 2504 Abbeywood Ct
- 3306 Darby St Unit 402
- 3342 Darby St Unit 317
- 2358 Medina Ave
- 2514 Glenhurst Ct
- 2282 Brentwood St
- 2433 Medina Ave
- 3082 Galena Ave
- 3064 Galena Ave
- 2269 Ravenna St
- 3045 Galena Ave
- 3434 Highwood Ct Unit 183
- 3326 Wilmot St
- 2660 Tumbleweed Ave
- 2753 Deerwood Ave
- 3474 Highwood Ct Unit 80
- 3174 Darby St Unit 205
- 3174 Darby St Unit 105
- 3174 Darby St Unit 206
- 3180 Darby St Unit 222
- 3180 Darby St Unit 122
- 3180 Darby St Unit 221
- 3180 Darby St Unit 121
- 3168 Darby St Unit 207
- 3168 Darby St Unit 107
- 3216 Darby St Unit 203
- 3216 Darby St Unit 103
- 3216 Darby St Unit 204
- 3216 Darby St Unit 104
- 3186 Darby St Unit 220
- 3186 Darby St Unit 120
- 3186 Darby St Unit 219
- 3186 Darby St Unit 119
- 3162 Darby St Unit 110
- 3162 Darby St Unit 209
- 3162 Darby St Unit 109