3174 W Fox Run Way Unit 2 San Diego, CA 92111
Clairemont Mesa West NeighborhoodEstimated Value: $933,000 - $1,178,000
4
Beds
3
Baths
2,061
Sq Ft
$504/Sq Ft
Est. Value
About This Home
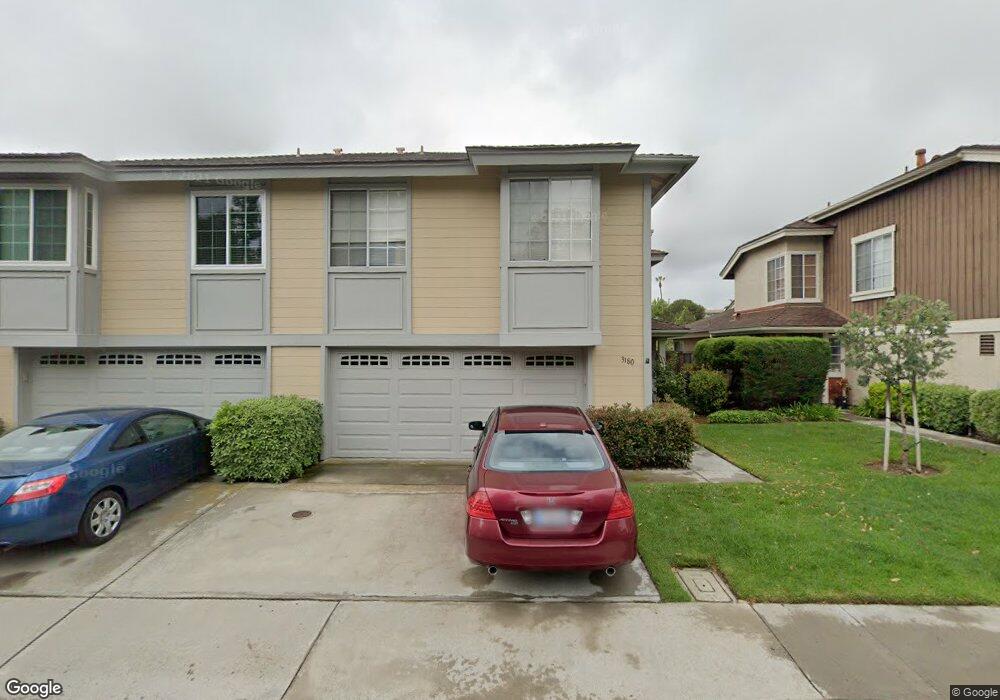
This home is located at 3174 W Fox Run Way Unit 2, San Diego, CA 92111 and is currently estimated at $1,037,936, approximately $503 per square foot. 3174 W Fox Run Way Unit 2 is a home located in San Diego County with nearby schools including Holmes Elementary, Marston Middle School, and Clairemont High School.
Ownership History
Date
Name
Owned For
Owner Type
Purchase Details
Closed on
Nov 28, 2007
Sold by
Perez Richard J and Perez Nancy A
Bought by
Perez Richard Johann and Perez Nancy Annette
Current Estimated Value
Purchase Details
Closed on
Aug 1, 2001
Sold by
Mahoney Paul J and Mahoney Sophie
Bought by
Perez Richard J and Perez Nancy A
Home Financials for this Owner
Home Financials are based on the most recent Mortgage that was taken out on this home.
Original Mortgage
$246,000
Interest Rate
7.19%
Purchase Details
Closed on
Sep 15, 1999
Sold by
Maichen Jeffrey W and Maichen Marianne F
Bought by
Mahoney Paul J and Mahoney Sophie
Home Financials for this Owner
Home Financials are based on the most recent Mortgage that was taken out on this home.
Original Mortgage
$223,200
Interest Rate
8.99%
Purchase Details
Closed on
Jul 13, 1999
Sold by
Maichen Jeffrey W and Maichen Marianne F
Bought by
Maichen Jeffrey W and Maichen Marianne F
Purchase Details
Closed on
Sep 23, 1983
Create a Home Valuation Report for This Property
The Home Valuation Report is an in-depth analysis detailing your home's value as well as a comparison with similar homes in the area
Home Values in the Area
Average Home Value in this Area
Purchase History
| Date | Buyer | Sale Price | Title Company |
|---|---|---|---|
| Perez Richard Johann | -- | None Available | |
| Perez Richard J | $352,000 | United Title Company | |
| Mahoney Paul J | $279,000 | Southland Title | |
| Maichen Jeffrey W | -- | -- | |
| -- | $120,000 | -- |
Source: Public Records
Mortgage History
| Date | Status | Borrower | Loan Amount |
|---|---|---|---|
| Previous Owner | Perez Richard J | $246,000 | |
| Previous Owner | Mahoney Paul J | $223,200 | |
| Closed | Mahoney Paul J | $50,000 |
Source: Public Records
Tax History Compared to Growth
Tax History
| Year | Tax Paid | Tax Assessment Tax Assessment Total Assessment is a certain percentage of the fair market value that is determined by local assessors to be the total taxable value of land and additions on the property. | Land | Improvement |
|---|---|---|---|---|
| 2025 | $6,207 | $519,987 | $295,451 | $224,536 |
| 2024 | $6,207 | $509,792 | $289,658 | $220,134 |
| 2023 | $6,068 | $499,797 | $283,979 | $215,818 |
| 2022 | $5,905 | $489,998 | $278,411 | $211,587 |
| 2021 | $5,863 | $480,391 | $272,952 | $207,439 |
| 2020 | $5,792 | $475,466 | $270,154 | $205,312 |
| 2019 | $5,687 | $466,144 | $264,857 | $201,287 |
| 2018 | $5,316 | $457,005 | $259,664 | $197,341 |
| 2017 | $80 | $448,045 | $254,573 | $193,472 |
| 2016 | $5,104 | $439,261 | $249,582 | $189,679 |
| 2015 | $5,028 | $432,664 | $245,834 | $186,830 |
| 2014 | $4,947 | $424,190 | $241,019 | $183,171 |
Source: Public Records
Map
Nearby Homes
- 3226 Old Heather Rd
- 3014 Old Bridgeport Way
- 3120 Old Bridgeport Way
- 3270 W Fox Run Way Unit 2
- 3262 Mount Carol Dr
- 3298 Old Heather Rd
- 3218 Old Bridgeport Way
- 3047 Old Bridgeport Way
- 3161 Mount Tami Dr
- 3710 Old Cobble Rd
- 3516 Old Cobble Rd
- 5581 Mount Acara Dr
- 3581 Mount Abbey Ave
- 3173 Via Arcilla
- 3405 Aveley Place
- 3413 Rollsreach Dr
- 2868-70 Preece St
- 2750 Wheatstone St Unit 110
- 2750 Wheatstone St Unit 113
- 2750 Wheatstone St Unit 105
- 3180 W Fox Run Way
- 3170 W Fox Run Way
- 3184 W Fox Run Way
- 3190 W Fox Run Way
- 3160 W Fox Run Way
- 3194 W Fox Run Way
- 3154 W Fox Run Way
- 3196 Old Kettle Rd
- 3204 Old Kettle Rd
- 3190 Old Kettle Rd
- 3210 Old Kettle Rd
- 3186 Old Kettle Rd
- 3204 W Fox Run Way
- 3216 Old Kettle Rd
- 3180 Old Kettle Rd
- 3220 Old Kettle Rd
- 3176 Old Kettle Rd
- 3210 W Fox Run Way
- 3144 W Fox Run Way
- 3226 Old Kettle Rd