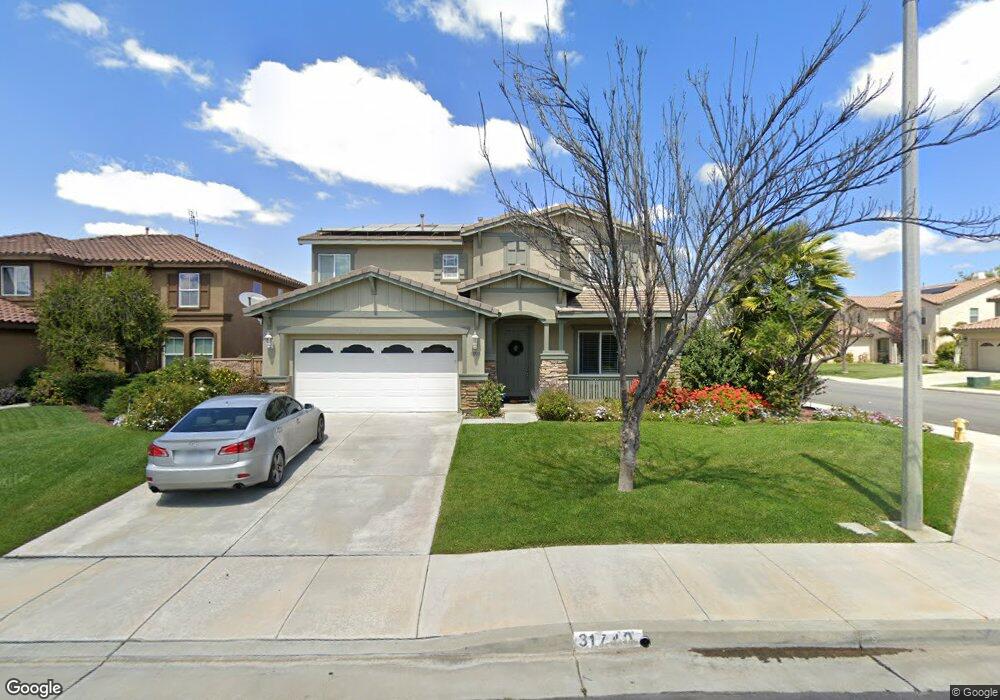
31740 Pompei Ln Winchester, CA 92596
Estimated Value: $622,000 - $667,000
3
Beds
3
Baths
2,492
Sq Ft
$258/Sq Ft
Est. Value
About This Home
This home is located at 31740 Pompei Ln, Winchester, CA 92596 and is currently estimated at $643,948, approximately $258 per square foot. 31740 Pompei Ln is a home located in Riverside County with nearby schools including French Valley Elementary School, Bella Vista Middle School, and Chaparral High School.
Ownership History
Date
Name
Owned For
Owner Type
Purchase Details
Closed on
Jul 14, 2020
Sold by
Lo Lam Dinh and Nguyen Hanh Kieu
Bought by
Lo Loc D
Current Estimated Value
Purchase Details
Closed on
Aug 27, 2018
Sold by
Lo Lam Dinh and Nguyen Hanh Kieu
Bought by
Lam Dinh Lo and Lam Hanh Kieu Nguyen Rlt
Purchase Details
Closed on
Oct 10, 2008
Sold by
Us Bank National Association
Bought by
Lo Lam Dinh and Nguyen Hanh Kieu
Purchase Details
Closed on
Aug 15, 2008
Sold by
Aquino Abraham O and Aquino Verna S
Bought by
U S Bank Na
Purchase Details
Closed on
Jun 22, 2005
Sold by
Kb Home Coastal Inc
Bought by
Aguino Abraham O and Aguino Verna S
Home Financials for this Owner
Home Financials are based on the most recent Mortgage that was taken out on this home.
Original Mortgage
$380,900
Interest Rate
5.87%
Mortgage Type
Fannie Mae Freddie Mac
Create a Home Valuation Report for This Property
The Home Valuation Report is an in-depth analysis detailing your home's value as well as a comparison with similar homes in the area
Home Values in the Area
Average Home Value in this Area
Purchase History
| Date | Buyer | Sale Price | Title Company |
|---|---|---|---|
| Lo Loc D | -- | None Available | |
| Lam Dinh Lo | -- | None Available | |
| Lo Lam Dinh | -- | None Available | |
| Lo Lam Dinh | $227,000 | None Available | |
| U S Bank Na | $243,000 | None Available | |
| Aguino Abraham O | $476,500 | First American Title Company |
Source: Public Records
Mortgage History
| Date | Status | Borrower | Loan Amount |
|---|---|---|---|
| Previous Owner | Aguino Abraham O | $380,900 |
Source: Public Records
Tax History Compared to Growth
Tax History
| Year | Tax Paid | Tax Assessment Tax Assessment Total Assessment is a certain percentage of the fair market value that is determined by local assessors to be the total taxable value of land and additions on the property. | Land | Improvement |
|---|---|---|---|---|
| 2025 | $5,587 | $292,300 | $90,133 | $202,167 |
| 2023 | $5,587 | $280,951 | $86,634 | $194,317 |
| 2022 | $8,234 | $534,480 | $153,000 | $381,480 |
| 2021 | $5,392 | $270,043 | $83,271 | $186,772 |
| 2020 | $5,338 | $267,275 | $82,418 | $184,857 |
| 2019 | $5,188 | $262,035 | $80,802 | $181,233 |
| 2018 | $5,016 | $256,898 | $79,218 | $177,680 |
| 2017 | $4,967 | $251,862 | $77,665 | $174,197 |
| 2016 | $4,911 | $246,925 | $76,143 | $170,782 |
| 2015 | $4,863 | $243,218 | $75,000 | $168,218 |
| 2014 | $4,787 | $238,456 | $73,532 | $164,924 |
Source: Public Records
Map
Nearby Homes
- 31556 Umbria Ln
- 31796 Gimbal Way
- 36358 Matino Ln
- 31771 Biagio Way
- 31759 Delfina Way
- 36315 Antoinette Ln
- 36355 Amerigo Ln
- 36362 Arcs St
- 36316 Cosimo Ln
- 36415 Flare Dr
- 36316 Grazia Way Unit 167
- 36320 Grazia Way
- 31809 Delfina Way
- 31572 Adour Way
- 31556 Vignes Ct
- 31659 Poppy St
- 36423 Rotterdam St
- 36628 Chantecler Rd
- 31867 Crecy Dr
- 31851 Pepper Tree St
- 31728 Pompei Ln
- 36415 Sicily Ln
- 31716 Pompei Ln
- 36403 Sicily Ln
- 36436 Sicily Ln
- 36424 Sicily Ln
- 31704 Pompei Ln
- 31737 Pompei Ln
- 36412 Sicily Ln
- 31725 Pompei Ln
- 36379 Sicily Ln
- 31749 Pompei Ln
- 36369 Ancona Ct
- 36400 Sicily Ln
- 31692 Pompei Ln
- 36419 Yost St
- 36393 Yost St
- 36445 Yost St
- 31701 Pompei Ln
- 36354 Ancona Ct