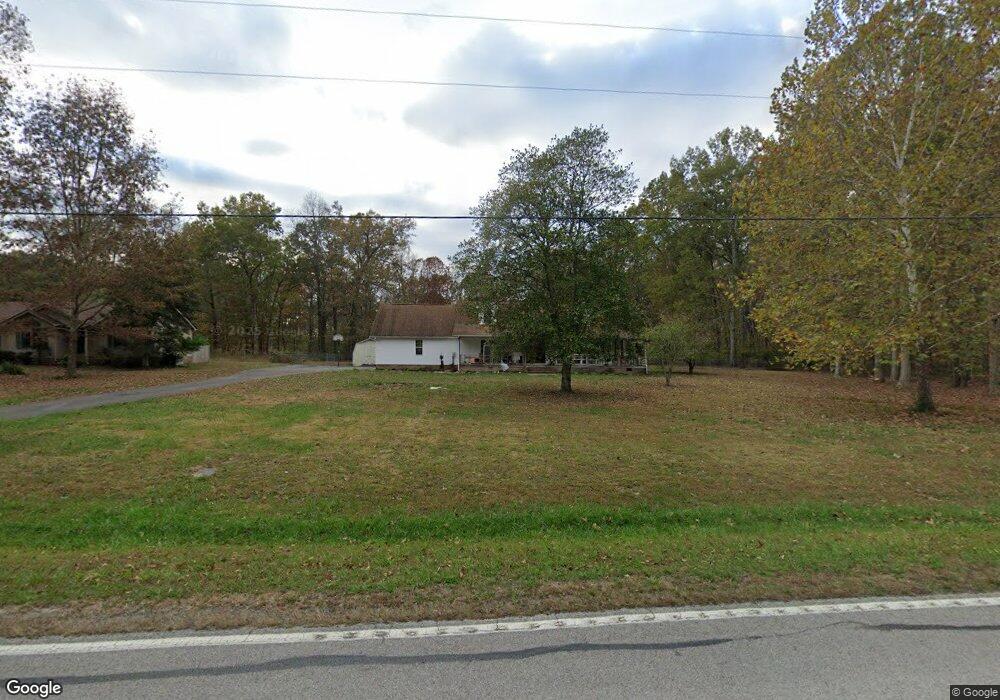
3175 Awalt Rd Tullahoma, TN 37388
Estimated Value: $308,000 - $390,000
--
Bed
2
Baths
1,950
Sq Ft
$170/Sq Ft
Est. Value
About This Home
This home is located at 3175 Awalt Rd, Tullahoma, TN 37388 and is currently estimated at $330,905, approximately $169 per square foot. 3175 Awalt Rd is a home located in Franklin County with nearby schools including North Middle School, Franklin County High School, and Tullahoma Sda School.
Ownership History
Date
Name
Owned For
Owner Type
Purchase Details
Closed on
May 19, 2023
Sold by
Richardson Brandon K
Bought by
Parker Carl Howard
Current Estimated Value
Home Financials for this Owner
Home Financials are based on the most recent Mortgage that was taken out on this home.
Original Mortgage
$200,000
Outstanding Balance
$194,326
Interest Rate
6.28%
Mortgage Type
Construction
Estimated Equity
$136,579
Purchase Details
Closed on
Sep 15, 2015
Sold by
Richardson Lisa M
Bought by
Richardson Brandon K
Purchase Details
Closed on
Sep 24, 2008
Sold by
Wachovia Bank Na
Bought by
Richardson Brandon K
Purchase Details
Closed on
Jul 20, 2000
Sold by
Henderson Jerry
Bought by
Crutchfield James A and Crutchfield Sonj
Purchase Details
Closed on
Nov 23, 1993
Sold by
Anderson Stanley Lee
Bought by
Locke Gilbert W
Purchase Details
Closed on
Aug 6, 1992
Bought by
Anderson Stanley Lee and Ona Nell
Purchase Details
Closed on
May 18, 1989
Bought by
Lynch Kenneth W
Create a Home Valuation Report for This Property
The Home Valuation Report is an in-depth analysis detailing your home's value as well as a comparison with similar homes in the area
Home Values in the Area
Average Home Value in this Area
Purchase History
| Date | Buyer | Sale Price | Title Company |
|---|---|---|---|
| Parker Carl Howard | $250,000 | None Listed On Document | |
| Richardson Brandon K | -- | -- | |
| Richardson Brandon K | $122,000 | -- | |
| Crutchfield James A | $147,500 | -- | |
| Locke Gilbert W | $109,000 | -- | |
| Anderson Stanley Lee | -- | -- | |
| Lynch Kenneth W | -- | -- |
Source: Public Records
Mortgage History
| Date | Status | Borrower | Loan Amount |
|---|---|---|---|
| Open | Parker Carl Howard | $200,000 |
Source: Public Records
Tax History Compared to Growth
Tax History
| Year | Tax Paid | Tax Assessment Tax Assessment Total Assessment is a certain percentage of the fair market value that is determined by local assessors to be the total taxable value of land and additions on the property. | Land | Improvement |
|---|---|---|---|---|
| 2024 | $1,287 | $64,525 | $7,350 | $57,175 |
| 2023 | $1,287 | $64,525 | $7,350 | $57,175 |
| 2022 | $1,210 | $64,525 | $7,350 | $57,175 |
| 2021 | $1,107 | $64,525 | $7,350 | $57,175 |
| 2020 | $1,107 | $38,450 | $5,100 | $33,350 |
| 2019 | $1,107 | $38,450 | $5,100 | $33,350 |
| 2018 | $1,028 | $38,450 | $5,100 | $33,350 |
| 2017 | $1,416 | $52,975 | $5,100 | $47,875 |
| 2016 | $1,249 | $46,725 | $4,550 | $42,175 |
| 2015 | $1,249 | $46,725 | $4,550 | $42,175 |
| 2014 | $1,250 | $46,741 | $0 | $0 |
Source: Public Records
Map
Nearby Homes
- 384 Evans Dr
- 120 Evans Dr
- 215 Evans Dr
- 400 Evans Dr
- 460 Evans Dr
- 493 Evans Dr
- 223 Patriot Ln
- 354 Riddle Ln
- 0 Hurricane Rd
- 0 Hasty Ln Unit RTC2993390
- 796 Highland Ridge Rd
- 560 Lake Haven Dr
- 10831 Old Tullahoma Rd
- 5425 Awalt Rd
- 0 Turkey Creek Boat Dock Rd
- 5453 Awalt Rd
- 807 Hasty Ln
- 169 Henley Rd
- 90 Grandview Lake Rd
- 0 Damron Rd Unit RTC2819420
- 3151 Awalt Rd
- 3115 Awalt Rd
- 3180 Awalt Rd
- 65 Secluded Ln
- 3081 Awalt Rd
- 3211 Awalt Rd
- 3260 Awalt Rd
- 3059 Awalt Rd
- 1755 Hurricane Rd
- 3339 Awalt Rd
- 0 Awalt Rd Unit RTC2399187
- 1754 Hurricane Rd
- 1701 Hurricane Rd
- 1722 Hurricane Rd
- 261 Old Awalt Rd
- 1686 Hurricane Rd
- 3443 Awalt Rd
- 3404 Awalt Rd
- 199 Mica Ln
- 1637 Hurricane Rd