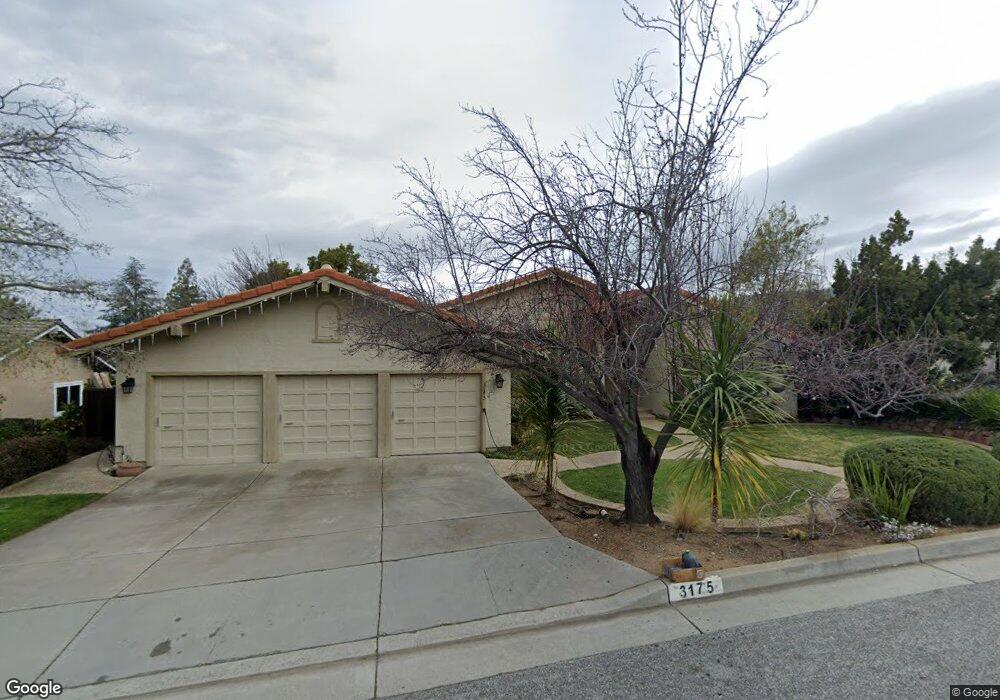
3175 High Meadow Ln San Jose, CA 95135
The Meadowlands NeighborhoodEstimated Value: $2,337,828 - $2,752,000
4
Beds
3
Baths
2,700
Sq Ft
$967/Sq Ft
Est. Value
About This Home
This home is located at 3175 High Meadow Ln, San Jose, CA 95135 and is currently estimated at $2,610,207, approximately $966 per square foot. 3175 High Meadow Ln is a home located in Santa Clara County with nearby schools including Silver Oak Elementary School, Chaboya Middle School, and Silver Creek High School.
Ownership History
Date
Name
Owned For
Owner Type
Purchase Details
Closed on
Sep 18, 2023
Sold by
Nguyen Loc Luu and Nguyen Jane G
Bought by
Nguyen Living Trust and Nguyen
Current Estimated Value
Purchase Details
Closed on
Apr 22, 2015
Sold by
Nguyen Loc L and Nguyen Jane G
Bought by
Nguyen Loc L and Nguyen Jane G
Purchase Details
Closed on
Apr 2, 2008
Sold by
Gaeta Edward J and Gaeta Sarah Lr
Bought by
Nguyen Loc L and Nguyen Jane G
Home Financials for this Owner
Home Financials are based on the most recent Mortgage that was taken out on this home.
Original Mortgage
$872,000
Interest Rate
6.87%
Mortgage Type
Purchase Money Mortgage
Purchase Details
Closed on
Jun 29, 2005
Sold by
Gaeta Edward J
Bought by
Gaeta Edward J and Gaeta Sarah Lr
Purchase Details
Closed on
Mar 4, 2003
Sold by
Gaeta Anita
Bought by
Gaeta Edward J
Home Financials for this Owner
Home Financials are based on the most recent Mortgage that was taken out on this home.
Original Mortgage
$650,000
Interest Rate
5.83%
Purchase Details
Closed on
Aug 30, 1999
Sold by
Paripatyadar Rajesh A and Paripatyadar Meera B
Bought by
Fjallstam Jonas M
Home Financials for this Owner
Home Financials are based on the most recent Mortgage that was taken out on this home.
Original Mortgage
$524,000
Interest Rate
2.95%
Purchase Details
Closed on
Nov 19, 1998
Sold by
Paripatyadar Rajesh A and Paripatyadar Meera B
Bought by
Paripatyadar Rajesh A and Paripatyadar Meera B
Home Financials for this Owner
Home Financials are based on the most recent Mortgage that was taken out on this home.
Original Mortgage
$270,800
Interest Rate
6.87%
Purchase Details
Closed on
Oct 6, 1997
Sold by
Paripatyadar Rajesh A and Paripatyadar Meera B
Bought by
Paripatyadar Rajesh A and Paripatyadar Meera B
Home Financials for this Owner
Home Financials are based on the most recent Mortgage that was taken out on this home.
Original Mortgage
$274,000
Interest Rate
6.62%
Purchase Details
Closed on
Sep 22, 1997
Sold by
Paripatyadar Rajesh A and Paripatyadar Meera B
Bought by
Paripatyadar Rajesh A and Paripatyadar Meera B
Home Financials for this Owner
Home Financials are based on the most recent Mortgage that was taken out on this home.
Original Mortgage
$274,000
Interest Rate
6.62%
Purchase Details
Closed on
Apr 25, 1997
Sold by
Paripatyadar Rajesh A and Paripatyadar Meera B
Bought by
Paripatyadar Rajesh A and Paripatyadar Meera B
Create a Home Valuation Report for This Property
The Home Valuation Report is an in-depth analysis detailing your home's value as well as a comparison with similar homes in the area
Home Values in the Area
Average Home Value in this Area
Purchase History
| Date | Buyer | Sale Price | Title Company |
|---|---|---|---|
| Nguyen Living Trust | -- | None Listed On Document | |
| Nguyen Loc L | -- | None Available | |
| Nguyen Loc L | $1,090,000 | Old Republic Title Company | |
| Gaeta Edward J | -- | -- | |
| Gaeta Edward J | -- | Chicago Title | |
| Gaeta Edward J | $850,000 | Chicago Title | |
| Fjallstam Jonas M | $655,000 | Financial Title Company | |
| Paripatyadar Rajesh A | -- | Financial Title Company | |
| Paripatyadar Rajesh A | -- | -- | |
| Paripatyadar Rajesh A | -- | Fidelity National Title Co | |
| Paripatyadar Rajesh A | -- | -- | |
| Paripatyadar Rajesh A | -- | -- |
Source: Public Records
Mortgage History
| Date | Status | Borrower | Loan Amount |
|---|---|---|---|
| Previous Owner | Nguyen Loc L | $872,000 | |
| Previous Owner | Gaeta Edward J | $650,000 | |
| Previous Owner | Fjallstam Jonas M | $524,000 | |
| Previous Owner | Paripatyadar Rajesh A | $270,800 | |
| Previous Owner | Paripatyadar Rajesh A | $274,000 |
Source: Public Records
Tax History Compared to Growth
Tax History
| Year | Tax Paid | Tax Assessment Tax Assessment Total Assessment is a certain percentage of the fair market value that is determined by local assessors to be the total taxable value of land and additions on the property. | Land | Improvement |
|---|---|---|---|---|
| 2025 | $19,863 | $1,434,049 | $717,415 | $716,634 |
| 2024 | $19,863 | $1,405,932 | $703,349 | $702,583 |
| 2023 | $19,510 | $1,378,365 | $689,558 | $688,807 |
| 2022 | $19,404 | $1,351,339 | $676,038 | $675,301 |
| 2021 | $19,115 | $1,324,843 | $662,783 | $662,060 |
| 2020 | $17,995 | $1,311,259 | $655,987 | $655,272 |
| 2019 | $18,308 | $1,285,549 | $643,125 | $642,424 |
| 2018 | $18,187 | $1,260,343 | $630,515 | $629,828 |
| 2017 | $17,879 | $1,235,631 | $618,152 | $617,479 |
| 2016 | $17,066 | $1,211,404 | $606,032 | $605,372 |
| 2015 | $16,451 | $1,191,274 | $595,637 | $595,637 |
| 2014 | -- | $1,119,000 | $559,500 | $559,500 |
Source: Public Records
Map
Nearby Homes
- 8411 Chenin Blanc Ln
- 8423 Chenin Blanc Ln
- 8386 Riesling Way
- 8356 Charbono Ct
- 8366 Riesling Way
- 8501 Grenache Ct
- 8480 Grenache Ct Unit 8480
- 8449 Traminer Ct
- 8030 Pinot Noir Ct
- 8463 Traminer Ct
- 8021 Pinot Noir Ct Unit 8021
- 8718 Mccarty Ranch Dr
- 3603 Meadowlands Ln
- 6354 Whaley Dr
- 7886 Moorfoot Ct Unit 7886
- 8845 Wine Valley Cir
- 6098 Montgomery Ct Unit B98
- 6094 Montgomery Ct
- 7530 Morevern Cir
- 8853 Wine Valley Cir
- 3163 High Meadow Ln
- 8330 Pinotage Ct
- 8328 Pinotage Ct
- 8332 Pinotage Ct
- 8326 Pinotage Ct Unit 8326
- 8326 Pinotage Ct
- 3151 High Meadow Ln
- 3185 Meadowlands Ln
- 3160 High Meadow Ln
- 3199 High Meadow Ln
- 3294 High Meadow Ln
- 8324 Pinotage Ct
- 8321 Pinotage Ct
- 8323 Pinotage Ct
- 3139 High Meadow Ln
- 8325 Pinotage Ct
- 8327 Pinotage Ct
- 8331 Pinotage Ct
- 8322 Pinotage Ct
- 8329 Pinotage Ct