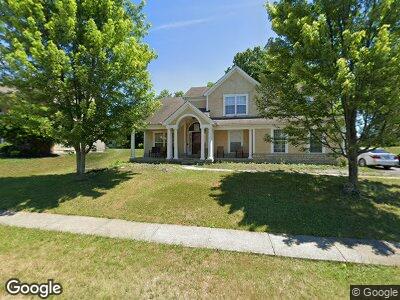
3176 Cannock Ln Columbus, OH 43219
Easton NeighborhoodEstimated Value: $407,000 - $516,000
4
Beds
3
Baths
3,516
Sq Ft
$133/Sq Ft
Est. Value
About This Home
This home is located at 3176 Cannock Ln, Columbus, OH 43219 and is currently estimated at $467,777, approximately $133 per square foot. 3176 Cannock Ln is a home located in Franklin County with nearby schools including Innis Elementary School, Mifflin Middle School, and Mifflin High School.
Ownership History
Date
Name
Owned For
Owner Type
Purchase Details
Closed on
Sep 28, 2010
Sold by
Tillman Howard L and Tillman Delauna L
Bought by
Mcclendon Robert
Current Estimated Value
Purchase Details
Closed on
Dec 20, 2002
Sold by
Joshua Investment Company
Bought by
Tillman Howard L and Tillman Delauna L
Home Financials for this Owner
Home Financials are based on the most recent Mortgage that was taken out on this home.
Original Mortgage
$8,219
Interest Rate
6.3%
Mortgage Type
Unknown
Purchase Details
Closed on
Feb 13, 2002
Sold by
Robuck Investment Partnership
Bought by
Joshua Investment Company
Create a Home Valuation Report for This Property
The Home Valuation Report is an in-depth analysis detailing your home's value as well as a comparison with similar homes in the area
Home Values in the Area
Average Home Value in this Area
Purchase History
| Date | Buyer | Sale Price | Title Company |
|---|---|---|---|
| Mcclendon Robert | $210,000 | Attorney | |
| Tillman Howard L | $321,600 | Hummel Title Agency | |
| Joshua Investment Company | $40,000 | Central City Title Agency |
Source: Public Records
Mortgage History
| Date | Status | Borrower | Loan Amount |
|---|---|---|---|
| Open | Mcclendon Robert | $615,000 | |
| Closed | Mcclendon Robert | $615,000 | |
| Previous Owner | Tillman Howard L | $314,400 | |
| Previous Owner | Tillman Howard L | $78,600 | |
| Previous Owner | Tillman Howard L | $278,400 | |
| Previous Owner | Tillman Howard L | $69,600 | |
| Previous Owner | Tillman Howard L | $8,219 | |
| Previous Owner | Tillman Howard L | $317,500 |
Source: Public Records
Tax History Compared to Growth
Tax History
| Year | Tax Paid | Tax Assessment Tax Assessment Total Assessment is a certain percentage of the fair market value that is determined by local assessors to be the total taxable value of land and additions on the property. | Land | Improvement |
|---|---|---|---|---|
| 2024 | $6,302 | $140,430 | $23,630 | $116,800 |
| 2023 | $6,222 | $140,420 | $23,625 | $116,795 |
| 2022 | $12,049 | $157,430 | $24,080 | $133,350 |
| 2021 | $8,180 | $157,430 | $24,080 | $133,350 |
| 2020 | $8,190 | $157,430 | $24,080 | $133,350 |
| 2019 | $7,593 | $125,160 | $19,250 | $105,910 |
| 2018 | $6,004 | $125,160 | $19,250 | $105,910 |
| 2017 | $7,588 | $125,160 | $19,250 | $105,910 |
| 2016 | $4,881 | $73,680 | $22,440 | $51,240 |
| 2015 | $4,431 | $73,680 | $22,440 | $51,240 |
| 2014 | $4,441 | $73,680 | $22,440 | $51,240 |
| 2013 | $2,191 | $73,675 | $22,435 | $51,240 |
Source: Public Records
Map
Nearby Homes
- 3057 McCutcheon Crossing Dr
- 3339 Crossing Hill Way
- 2520 Mccutcheon Rd
- 3394 McCutcheon Crossing Dr
- 3183 Gideon Ln
- 3073 Kola Way
- 3087 Gideon Ln
- 4165 Sunbury Rd
- 3214 Kenray Dr
- 3106 Caralee Dr
- 3484 Sweetday St
- 2851 Regaldo Dr
- 3968 Middlemore Dr
- 3310 Framington Dr
- 3625 Parker Knoll Ln
- 3126 Dedham St
- 4136 Cambron Dr
- 2525 Dexham Ct
- 3497 Hillcreek Ct
- 2495 Hingham Ln
- 3176 Cannock Ln
- 3188 Cannock Ln
- 3164 Cannock Ln
- 3185 Cannock Ln
- 3173 Cannock Ln
- 3152 Cannock Ln
- 3125 Willow Springs Dr
- 3197 Cannock Ln
- 3200 Cannock Ln
- 3161 Cannock Ln
- 2395 Spring Lake Dr
- 3215 Genevieve Dr
- 3091 Willow Springs Dr
- 0 Cannock Ave
- 0 Cannock Ave
- 3140 Cannock Ln
- 3147 Cannock Ln
- 3190 Genevieve Dr
- 3178 Genevieve Dr
- 3202 Genevieve Dr