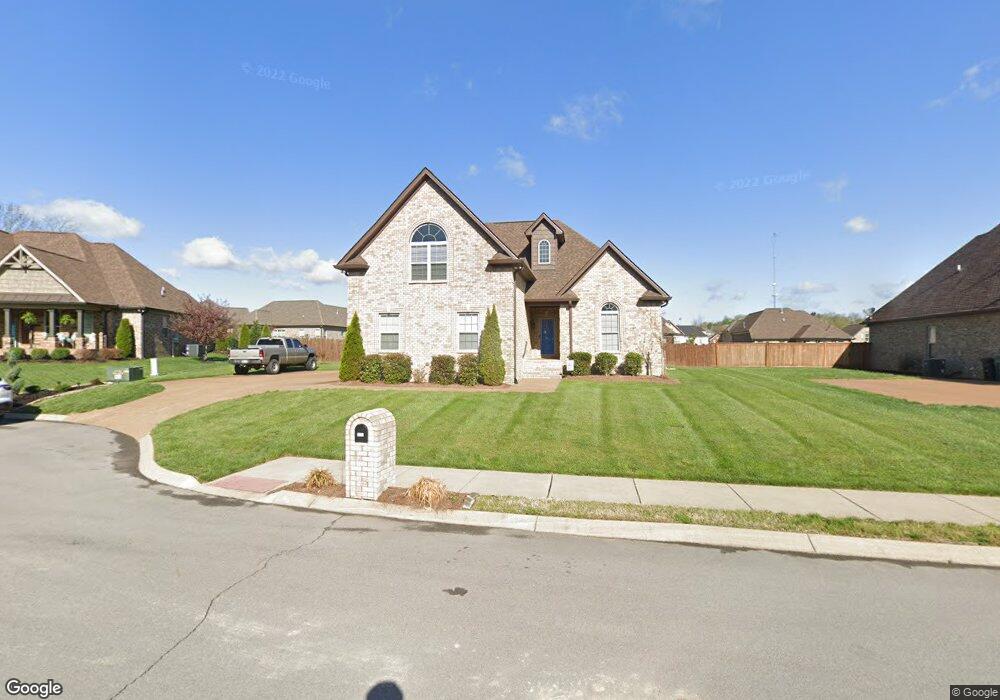
3178 Colchester Cir Unit 226-C Lebanon, TN 37087
Estimated Value: $501,883 - $576,000
3
Beds
2
Baths
2,200
Sq Ft
$244/Sq Ft
Est. Value
About This Home
This home is located at 3178 Colchester Cir Unit 226-C, Lebanon, TN 37087 and is currently estimated at $536,721, approximately $243 per square foot. 3178 Colchester Cir Unit 226-C is a home located in Wilson County with nearby schools including Castle Heights Elementary School, Winfree Bryant Middle School, and Lebanon High School.
Ownership History
Date
Name
Owned For
Owner Type
Purchase Details
Closed on
Dec 4, 2020
Sold by
King George and King Regina
Bought by
Corley Kelsey M and Corley James Brandon
Current Estimated Value
Home Financials for this Owner
Home Financials are based on the most recent Mortgage that was taken out on this home.
Original Mortgage
$334,248
Outstanding Balance
$298,111
Interest Rate
2.8%
Mortgage Type
FHA
Estimated Equity
$238,610
Purchase Details
Closed on
Jul 7, 2017
Sold by
Cornerstone Homes Inc
Bought by
King George and King Regina
Home Financials for this Owner
Home Financials are based on the most recent Mortgage that was taken out on this home.
Original Mortgage
$78,000
Interest Rate
3.91%
Mortgage Type
New Conventional
Purchase Details
Closed on
Jan 26, 2017
Sold by
Ehr Propeties Llc
Bought by
Corneerstone Homes Inc
Purchase Details
Closed on
May 29, 2015
Sold by
Community Dev Llc
Bought by
Ehr Properties Llc
Create a Home Valuation Report for This Property
The Home Valuation Report is an in-depth analysis detailing your home's value as well as a comparison with similar homes in the area
Home Values in the Area
Average Home Value in this Area
Purchase History
| Date | Buyer | Sale Price | Title Company |
|---|---|---|---|
| Corley Kelsey M | $365,000 | 1St Quality Title Llc | |
| King George | $324,800 | Horizon Land Title Inc | |
| Corneerstone Homes Inc | $57,000 | Horizon Land Title Inc | |
| Ehr Properties Llc | $398,400 | -- |
Source: Public Records
Mortgage History
| Date | Status | Borrower | Loan Amount |
|---|---|---|---|
| Open | Corley Kelsey M | $334,248 | |
| Previous Owner | King George | $78,000 |
Source: Public Records
Tax History Compared to Growth
Tax History
| Year | Tax Paid | Tax Assessment Tax Assessment Total Assessment is a certain percentage of the fair market value that is determined by local assessors to be the total taxable value of land and additions on the property. | Land | Improvement |
|---|---|---|---|---|
| 2024 | $1,899 | $86,075 | $18,125 | $67,950 |
| 2022 | $2,489 | $86,075 | $18,125 | $67,950 |
| 2021 | $2,489 | $86,075 | $18,125 | $67,950 |
| 2020 | $2,329 | $86,075 | $18,125 | $67,950 |
| 2019 | $2,166 | $61,750 | $8,625 | $53,125 |
| 2018 | $2,166 | $61,750 | $8,625 | $53,125 |
| 2017 | $302 | $8,625 | $8,625 | $0 |
Source: Public Records
Map
Nearby Homes
- 520 Briarhill Rd
- 3280 Nina Cir
- 1245 Tucker Dr
- 1405 Old Hebron Rd
- 2280 Tuckers Gap Rd
- 1229 Tucker Dr
- 212 Hickory Pointe Dr
- 1224 Tucker Dr
- Wilson Plan at Hickory Knoll
- Stapleton Plan at Hickory Knoll
- Paisley Plan at Hickory Knoll
- Johnson Plan at Hickory Knoll
- Morris Plan at Hickory Knoll
- Dolly Plan at Hickory Knoll
- 807 Hillock Trace
- 817 Hillock Trace
- 809 Hillock Trace
- 2555 Leeville Pike
- 815 Hillock Trace
- 511 Grassland Dr
- 3178 Colchester Cir
- 3176 Colchester Cir Unit 225
- 225 Colchester Circle #225
- 3176 Colchester Cir
- 3180 Colchester Cir Unit 227
- 3180 Colchester Cir
- 213 Monroe Way Unit 236
- 213 Monroe Way
- 215 Monroe Way Unit 237
- 215 Monroe Way
- 217 Monroe Way
- 3177 Colchester Cir Unit 224
- 3177 Colchester Cir
- 211 Monroe Way Unit 235
- 211 Monroe Way
- 3182 Colchester Cir Unit 228
- 3182 Colchester Cir
- 3179 Colchester Cir Unit 223
- 3179 Colchester Cir
- 209 Monroe Way Unit 234-C