318 175th Place SW Bothell, WA 98012
Estimated Value: $658,000 - $1,037,000
3
Beds
2
Baths
2,156
Sq Ft
$394/Sq Ft
Est. Value
About This Home
This home is located at 318 175th Place SW, Bothell, WA 98012 and is currently estimated at $849,482, approximately $394 per square foot. 318 175th Place SW is a home located in Snohomish County with nearby schools including Martha Lake Elementary School, Alderwood Middle School, and Lynnwood High School.
Ownership History
Date
Name
Owned For
Owner Type
Purchase Details
Closed on
Mar 21, 2018
Sold by
Mclain Ramona B and Read Richard A
Bought by
Read Richard A
Current Estimated Value
Purchase Details
Closed on
Sep 2, 2015
Sold by
Johansen Sherry and Hammond Brent
Bought by
Read Richard A and Mclain Ramona B
Home Financials for this Owner
Home Financials are based on the most recent Mortgage that was taken out on this home.
Original Mortgage
$247,500
Outstanding Balance
$194,395
Interest Rate
3.91%
Mortgage Type
New Conventional
Estimated Equity
$655,087
Purchase Details
Closed on
Dec 12, 2012
Sold by
Johansen Sherrry and Hammond Brent
Bought by
Snohomish County
Purchase Details
Closed on
Jun 11, 2009
Sold by
Larson Mary A
Bought by
Larson Mary A and Johansen Sherry
Create a Home Valuation Report for This Property
The Home Valuation Report is an in-depth analysis detailing your home's value as well as a comparison with similar homes in the area
Home Values in the Area
Average Home Value in this Area
Purchase History
| Date | Buyer | Sale Price | Title Company |
|---|---|---|---|
| Read Richard A | -- | None Available | |
| Read Richard A | $275,000 | Chicago Title | |
| Snohomish County | -- | None Available | |
| Larson Mary A | -- | None Available |
Source: Public Records
Mortgage History
| Date | Status | Borrower | Loan Amount |
|---|---|---|---|
| Open | Read Richard A | $247,500 |
Source: Public Records
Tax History Compared to Growth
Tax History
| Year | Tax Paid | Tax Assessment Tax Assessment Total Assessment is a certain percentage of the fair market value that is determined by local assessors to be the total taxable value of land and additions on the property. | Land | Improvement |
|---|---|---|---|---|
| 2025 | $5,205 | $643,700 | $441,400 | $202,300 |
| 2024 | $5,205 | $621,900 | $422,000 | $199,900 |
| 2023 | $5,464 | $683,600 | $475,300 | $208,300 |
| 2022 | $5,023 | $511,000 | $330,800 | $180,200 |
| 2020 | $4,779 | $431,000 | $269,700 | $161,300 |
| 2019 | $3,858 | $344,400 | $232,800 | $111,600 |
| 2018 | $4,005 | $315,500 | $213,400 | $102,100 |
| 2017 | $3,147 | $255,100 | $160,100 | $95,000 |
| 2016 | $3,503 | $286,600 | $141,600 | $145,000 |
| 2015 | $3,478 | $270,500 | $134,800 | $135,700 |
| 2013 | $3,105 | $228,900 | $110,000 | $118,900 |
Source: Public Records
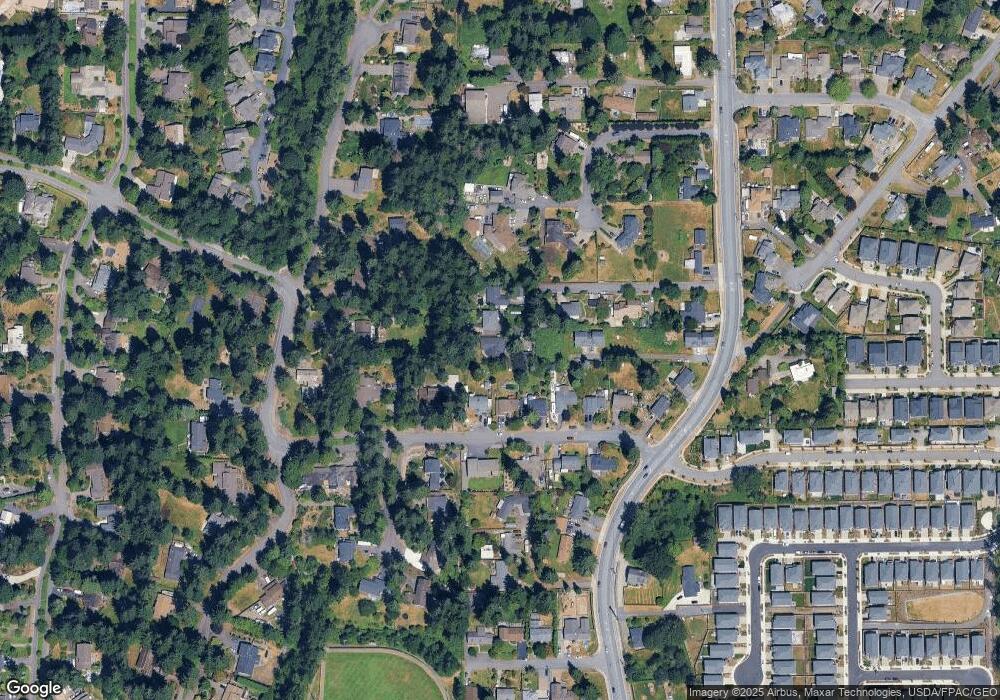
Map
Nearby Homes
- 17521 7th Ave W
- 17121 3rd Place W Unit 7
- 17312 Gravenstein Rd
- 17133 7th Place W
- 110 169th Place SW Unit B
- 110 169th Place SW Unit A
- 122 169th Place SW Unit B
- 122 169th Place SW Unit A
- 118 169th Place SW Unit A
- 118 169th Place SW Unit B
- 114 169th Place SW Unit B
- 16918 6th Ave W
- 17217 Larch Way
- 17828 Larch Way
- 130 178th St SE
- 18231 2nd Place W Unit A
- 0 Adjacent To Baldwin Rd
- 17723 3rd Ave SE
- 132 170th Place SE
- 17624 12th Place W
- 322 175th Place SW
- 321 176th Place SW
- 329 176th Place SW
- 326 175th Place SW
- 315 176th Place SW
- 409 176th Place SW
- 307 176th Place SW
- 310 175th Place SW
- 17526 North Rd
- 231 176th Place SW
- 230 174th St SW
- 226 174th St SW
- 17521 5th Ave W
- 328 176th Place SW
- 316 176th Place SW
- 421 176th Place SW
- 220 175th Place SW
- 306 176th Place SW
- 17627 4th Place W
- 17427 5th Ave W