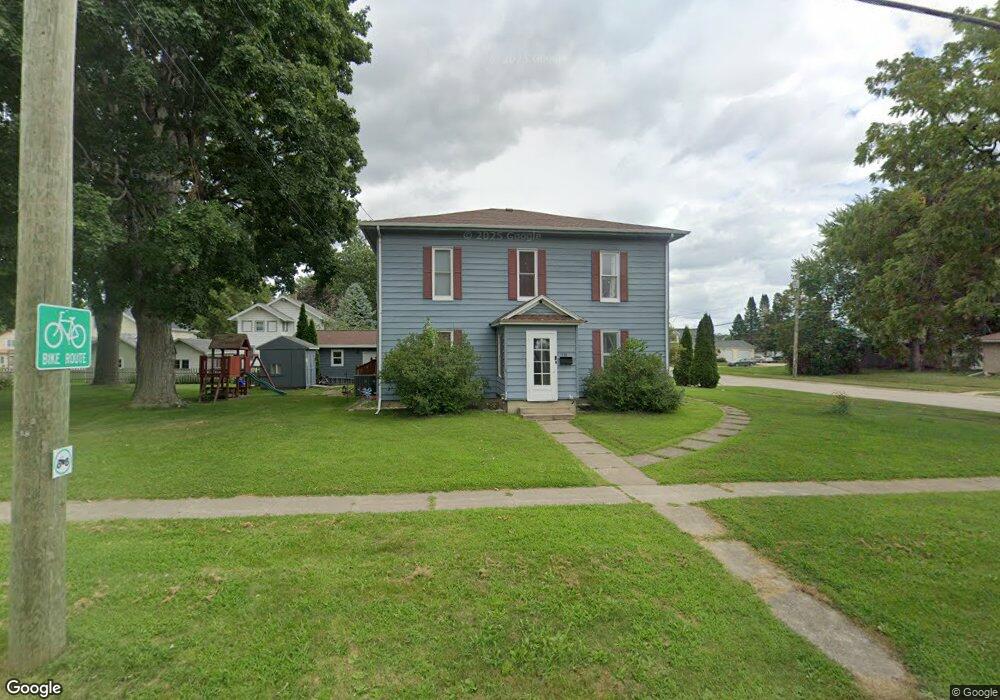
318 4th Ave SE Independence, IA 50644
Estimated Value: $166,000 - $208,000
4
Beds
4
Baths
2,447
Sq Ft
$78/Sq Ft
Est. Value
About This Home
This home is located at 318 4th Ave SE, Independence, IA 50644 and is currently estimated at $190,746, approximately $77 per square foot. 318 4th Ave SE is a home located in Buchanan County with nearby schools including West Elementary School, East Elementary School, and Independence Junior/Senior High School.
Ownership History
Date
Name
Owned For
Owner Type
Purchase Details
Closed on
Jun 24, 2008
Sold by
Lake George K and Lake Virginia S
Bought by
Mejia Juan C and Mejia Amanda M
Current Estimated Value
Home Financials for this Owner
Home Financials are based on the most recent Mortgage that was taken out on this home.
Original Mortgage
$84,400
Outstanding Balance
$53,659
Interest Rate
5.87%
Mortgage Type
Adjustable Rate Mortgage/ARM
Estimated Equity
$137,087
Create a Home Valuation Report for This Property
The Home Valuation Report is an in-depth analysis detailing your home's value as well as a comparison with similar homes in the area
Home Values in the Area
Average Home Value in this Area
Purchase History
| Date | Buyer | Sale Price | Title Company |
|---|---|---|---|
| Mejia Juan C | $85,000 | None Available |
Source: Public Records
Mortgage History
| Date | Status | Borrower | Loan Amount |
|---|---|---|---|
| Open | Mejia Juan C | $84,400 |
Source: Public Records
Tax History Compared to Growth
Tax History
| Year | Tax Paid | Tax Assessment Tax Assessment Total Assessment is a certain percentage of the fair market value that is determined by local assessors to be the total taxable value of land and additions on the property. | Land | Improvement |
|---|---|---|---|---|
| 2025 | $2,404 | $161,960 | $28,650 | $133,310 |
| 2024 | $2,404 | $130,230 | $25,580 | $104,650 |
| 2023 | $2,328 | $130,230 | $25,580 | $104,650 |
| 2022 | $2,014 | $104,660 | $20,300 | $84,360 |
| 2021 | $2,002 | $104,660 | $20,300 | $84,360 |
| 2020 | $2,002 | $96,670 | $18,610 | $78,060 |
| 2019 | $1,942 | $96,670 | $18,610 | $78,060 |
| 2018 | $1,858 | $92,900 | $18,610 | $74,290 |
| 2017 | $1,758 | $92,900 | $18,610 | $74,290 |
| 2016 | $1,726 | $87,040 | $10,070 | $76,970 |
| 2015 | $1,726 | $87,040 | $10,070 | $76,970 |
| 2014 | $1,762 | $87,040 | $10,070 | $76,970 |
Source: Public Records
Map
Nearby Homes