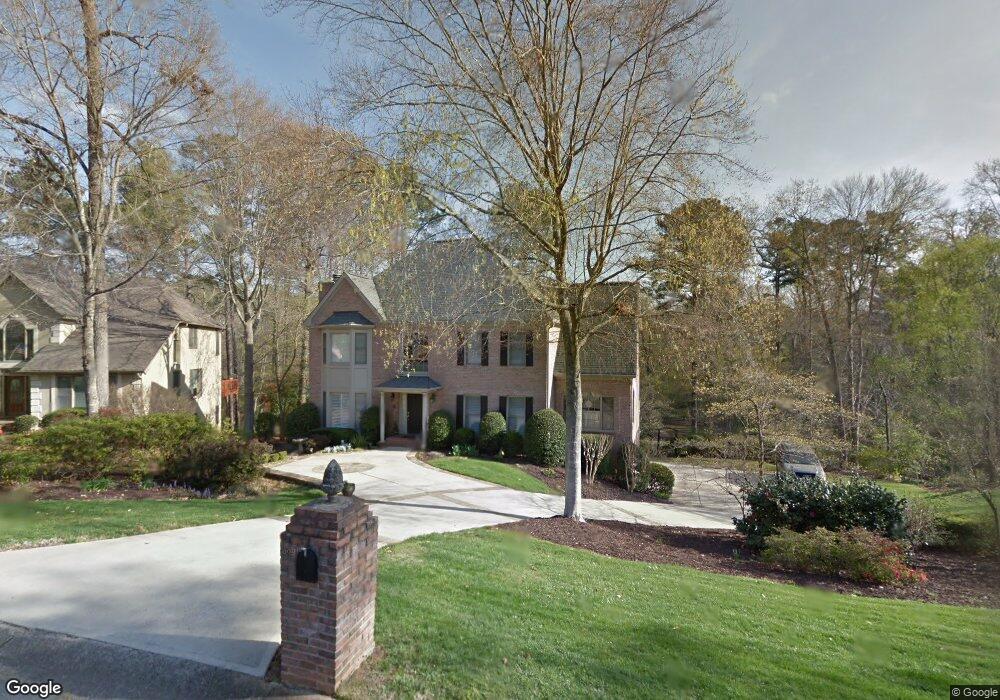
318 Chase Ln Marietta, GA 30068
Estimated Value: $815,745 - $1,002,000
4
Beds
4
Baths
3,512
Sq Ft
$259/Sq Ft
Est. Value
About This Home
This home is located at 318 Chase Ln, Marietta, GA 30068 and is currently estimated at $909,686, approximately $259 per square foot. 318 Chase Ln is a home located in Cobb County with nearby schools including Eastvalley Elementary School, East Cobb Middle School, and Wheeler High School.
Ownership History
Date
Name
Owned For
Owner Type
Purchase Details
Closed on
Apr 20, 2018
Sold by
Hoitnik William C
Bought by
Hoitnik William C and Hoitink Elaine D
Current Estimated Value
Purchase Details
Closed on
Jul 3, 2017
Sold by
Hoitink William C
Bought by
Hoitink William C
Purchase Details
Closed on
May 18, 2011
Sold by
Hoitink Elaine D
Bought by
Hoitink William C and Hoitink Elaine D
Home Financials for this Owner
Home Financials are based on the most recent Mortgage that was taken out on this home.
Original Mortgage
$159,700
Interest Rate
4.65%
Mortgage Type
New Conventional
Purchase Details
Closed on
Aug 9, 2006
Sold by
Hoitink Elaine D and Hoitink William C
Bought by
Hoitink Elaine D
Purchase Details
Closed on
Mar 16, 2006
Sold by
Hoitink Elaine C
Bought by
Hoitink William C and Hoitink Elaine D
Home Financials for this Owner
Home Financials are based on the most recent Mortgage that was taken out on this home.
Original Mortgage
$168,000
Interest Rate
6.25%
Mortgage Type
New Conventional
Create a Home Valuation Report for This Property
The Home Valuation Report is an in-depth analysis detailing your home's value as well as a comparison with similar homes in the area
Home Values in the Area
Average Home Value in this Area
Purchase History
| Date | Buyer | Sale Price | Title Company |
|---|---|---|---|
| Hoitnik William C | -- | -- | |
| Hoitink William C | -- | -- | |
| Hoitink William C | -- | -- | |
| Hoitink Elaine D | -- | -- | |
| Hoitink William C | -- | -- |
Source: Public Records
Mortgage History
| Date | Status | Borrower | Loan Amount |
|---|---|---|---|
| Previous Owner | Hoitink William C | $159,700 | |
| Previous Owner | Hoitink William C | $168,000 |
Source: Public Records
Tax History Compared to Growth
Tax History
| Year | Tax Paid | Tax Assessment Tax Assessment Total Assessment is a certain percentage of the fair market value that is determined by local assessors to be the total taxable value of land and additions on the property. | Land | Improvement |
|---|---|---|---|---|
| 2024 | $1,848 | $238,420 | $90,000 | $148,420 |
| 2023 | $1,588 | $220,256 | $90,000 | $130,256 |
| 2022 | $1,794 | $220,256 | $90,000 | $130,256 |
| 2021 | $1,794 | $220,256 | $90,000 | $130,256 |
| 2020 | $1,794 | $220,256 | $90,000 | $130,256 |
| 2019 | $1,704 | $190,160 | $48,000 | $142,160 |
| 2018 | $1,704 | $190,160 | $48,000 | $142,160 |
| 2017 | $1,429 | $168,772 | $48,000 | $120,772 |
| 2016 | $1,432 | $168,772 | $48,000 | $120,772 |
| 2015 | $1,466 | $148,324 | $45,144 | $103,180 |
| 2014 | $1,500 | $148,324 | $0 | $0 |
Source: Public Records
Map
Nearby Homes
- 2770 Beverly Hills Dr NE
- 2869 Old Sewell Rd
- 11 Cecil Dr
- 197 Carriage Trace
- 2431 Weatherford Ct
- 180 Blue Sky Dr
- 399 Old Canton Rd
- 280 E Valley Dr
- 382 Greenfield Ct
- 403 Greenfield Ct Unit 13
- 53 Weatherstone Pkwy
- 247 Millbrook Farm Rd
- 2811 Georgian Terrace Unit 5
- 3270 Brookview Dr
- 420 Greenfield Trace
- 20 Ashton Woods Dr
- 3040 Clearbrook Dr
- 2310 Old Sewell Rd
- 310 Clear Spring Ct
- 320 Chase Ln
- 316 Chase Ln
- 0 Chase Ln Unit 7514556
- 0 Chase Ln Unit 7032594
- 0 Chase Ln Unit 8466649
- 0 Chase Ln Unit 8817343
- 0 Chase Ln Unit 8045748
- 0 Chase Ln Unit 8230820
- 0 Chase Ln Unit 3290161
- 0 Chase Ln Unit 8027640
- 0 Chase Ln Unit 7567093
- 0 Chase Ln Unit 7379973
- 0 Chase Ln Unit 7293068
- 0 Chase Ln Unit 7199746
- 0 Chase Ln Unit 3250764
- 0 Chase Ln Unit 7349464
- 0 Chase Ln Unit 7278370
- 0 Chase Ln Unit 7226135
- 0 Chase Ln Unit 3242640
- 0 Chase Ln Unit 3152180