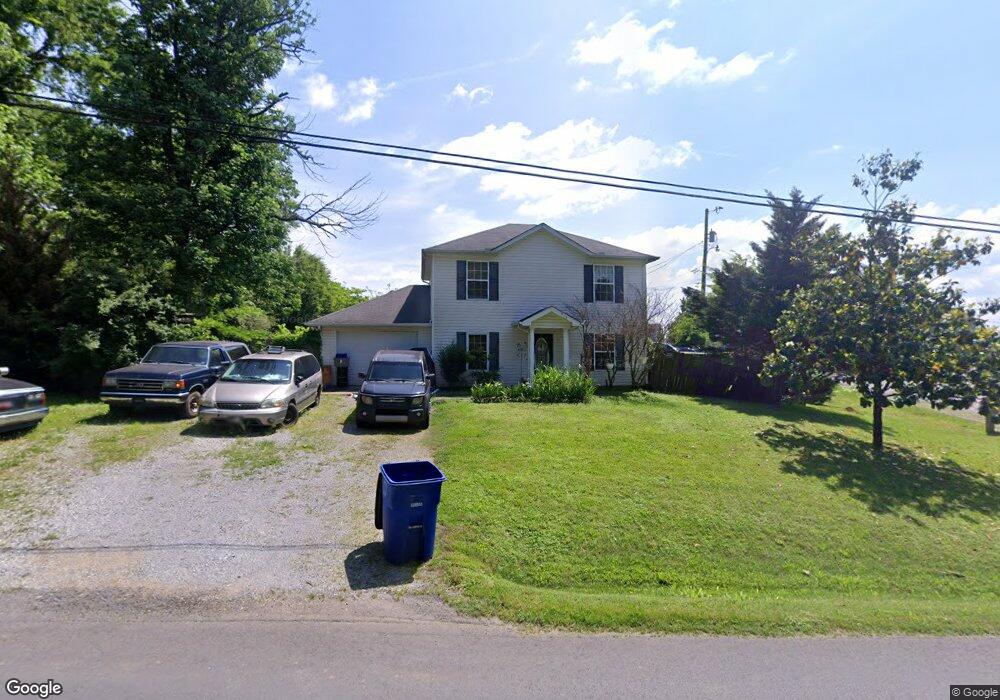
318 Cottonwood Dr Shelbyville, TN 37160
Estimated Value: $241,453 - $310,000
--
Bed
2
Baths
1,450
Sq Ft
$186/Sq Ft
Est. Value
About This Home
This home is located at 318 Cottonwood Dr, Shelbyville, TN 37160 and is currently estimated at $269,363, approximately $185 per square foot. 318 Cottonwood Dr is a home located in Bedford County with nearby schools including Eakin Elementary School, Harris Middle School, and Victory Baptist Academy.
Ownership History
Date
Name
Owned For
Owner Type
Purchase Details
Closed on
May 6, 2021
Sold by
Barnes John Robert
Bought by
Barnes Shannon L
Current Estimated Value
Purchase Details
Closed on
Apr 23, 2012
Sold by
Barnes John Douglas
Bought by
Barnes John Robert and Barnes Shannon L
Purchase Details
Closed on
Feb 24, 2009
Sold by
Secretary Of Housing
Bought by
Barnes John Douglas
Purchase Details
Closed on
Nov 11, 2008
Sold by
Cook Ragan C
Bought by
Secretary Of Housing
Purchase Details
Closed on
Feb 27, 2007
Sold by
Wells Fargo Bank
Bought by
Cook Ragan Christopher
Purchase Details
Closed on
Aug 4, 2004
Sold by
American Value Homes Inc
Bought by
Reedy Brenda Sue
Home Financials for this Owner
Home Financials are based on the most recent Mortgage that was taken out on this home.
Original Mortgage
$114,300
Interest Rate
8.13%
Create a Home Valuation Report for This Property
The Home Valuation Report is an in-depth analysis detailing your home's value as well as a comparison with similar homes in the area
Home Values in the Area
Average Home Value in this Area
Purchase History
| Date | Buyer | Sale Price | Title Company |
|---|---|---|---|
| Barnes Shannon L | -- | None Available | |
| Barnes John Robert | -- | -- | |
| Barnes John Douglas | $63,000 | -- | |
| Secretary Of Housing | $78,971 | -- | |
| Cook Ragan Christopher | $73,000 | -- | |
| Reedy Brenda Sue | $127,000 | -- |
Source: Public Records
Mortgage History
| Date | Status | Borrower | Loan Amount |
|---|---|---|---|
| Previous Owner | Reedy Brenda Sue | $114,300 |
Source: Public Records
Tax History Compared to Growth
Tax History
| Year | Tax Paid | Tax Assessment Tax Assessment Total Assessment is a certain percentage of the fair market value that is determined by local assessors to be the total taxable value of land and additions on the property. | Land | Improvement |
|---|---|---|---|---|
| 2025 | -- | $37,625 | $0 | $0 |
| 2024 | -- | $37,625 | $6,250 | $31,375 |
| 2023 | $1,432 | $37,625 | $6,250 | $31,375 |
| 2022 | $1,473 | $37,625 | $6,250 | $31,375 |
| 2021 | $1,337 | $37,625 | $6,250 | $31,375 |
| 2020 | $896 | $37,625 | $6,250 | $31,375 |
| 2019 | $896 | $20,225 | $2,500 | $17,725 |
| 2018 | $876 | $20,225 | $2,500 | $17,725 |
| 2017 | $876 | $20,225 | $2,500 | $17,725 |
| 2016 | $868 | $20,225 | $2,500 | $17,725 |
| 2015 | $868 | $20,225 | $2,500 | $17,725 |
| 2014 | $806 | $20,552 | $0 | $0 |
Source: Public Records
Map
Nearby Homes
- 312 Cottonwood Dr
- 102 Greystone Way
- 0 Archery Ln
- 102 Saddlewood Dr
- 1505 Green Ln
- 130 Horseshoe Dr
- 1507 Green Ln
- 129 Annas Way
- 1523 Green Ln
- 1525 Green Ln
- 115 Scotland Heights
- 402 Rose Ln
- 114 Collier Ave
- 201 Hickory Dr
- 223 Megan Cir
- 112 E Cedar St
- 134 Butler St
- 1017 Fairfield Pike
- 108 Thoroughbred Blvd
- 407 Dow Dr
- 4 Old Nashville Dirt Rd
- 3 Old Nashville Dirt Rd
- 316 Cottonwood Dr
- 106 Old Nashville Dirt Rd
- 315 Cottonwood Dr
- 118 Old Nashville Dirt Rd
- 314 Cottonwood Dr
- 414 Quarry St
- 313 Cottonwood Dr
- 307 Christopher Ct
- 1053 Morton St
- 412 Quarry St
- 309 Christopher Ct
- 311 Cottonwood Dr
- 305 Christopher Ct
- 310 Cottonwood Dr
- 410 Quarry St
- 310 Christopher Ct