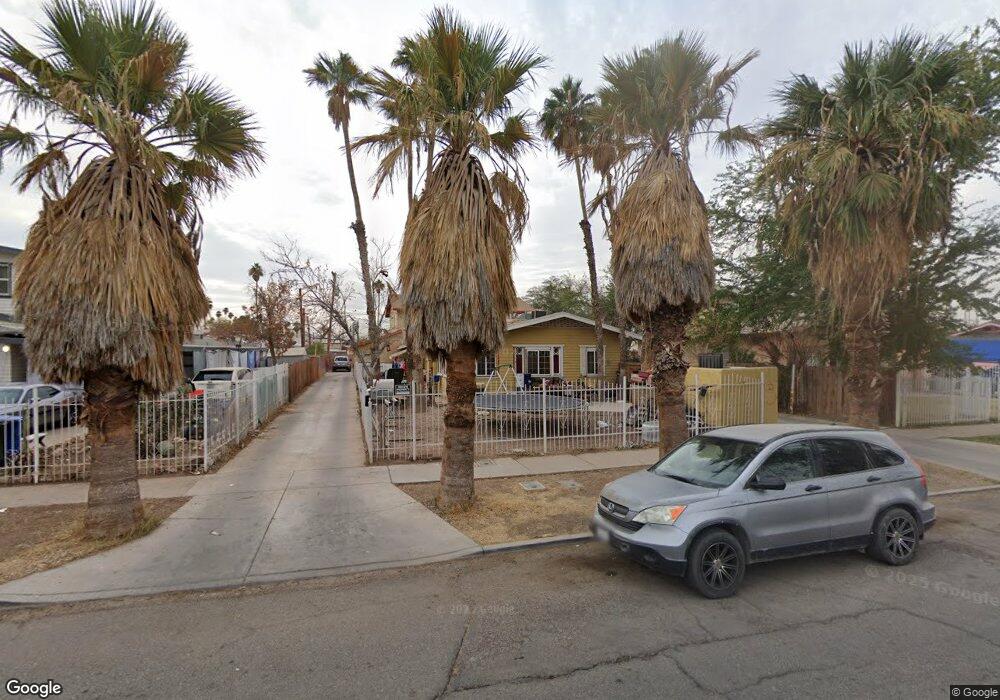
318 E 7th St Calexico, CA 92231
Estimated Value: $301,000 - $905,000
Studio
--
Bath
2,106
Sq Ft
$252/Sq Ft
Est. Value
About This Home
This home is located at 318 E 7th St, Calexico, CA 92231 and is currently estimated at $530,667, approximately $251 per square foot. 318 E 7th St is a home located in Imperial County with nearby schools including Rockwood Elementary School, William Moreno Junior High School, and Calexico High School.
Ownership History
Date
Name
Owned For
Owner Type
Purchase Details
Closed on
May 10, 2002
Sold by
Santos Jaime A and Santos Silvia S
Bought by
Martinez Frank and Martinez Ivonne
Current Estimated Value
Home Financials for this Owner
Home Financials are based on the most recent Mortgage that was taken out on this home.
Original Mortgage
$80,800
Outstanding Balance
$33,662
Interest Rate
6.74%
Mortgage Type
Commercial
Estimated Equity
$497,005
Purchase Details
Closed on
Feb 7, 2002
Sold by
Santos Jaime A and Santos Silvia S
Bought by
Santos Jaime A and Santos Silvia S
Create a Home Valuation Report for This Property
The Home Valuation Report is an in-depth analysis detailing your home's value as well as a comparison with similar homes in the area
Purchase History
| Date | Buyer | Sale Price | Title Company |
|---|---|---|---|
| Martinez Frank | $101,000 | First American Title Ins Co | |
| Santos Jaime A | -- | -- |
Source: Public Records
Mortgage History
| Date | Status | Borrower | Loan Amount |
|---|---|---|---|
| Open | Martinez Frank | $80,800 |
Source: Public Records
Tax History
| Year | Tax Paid | Tax Assessment Tax Assessment Total Assessment is a certain percentage of the fair market value that is determined by local assessors to be the total taxable value of land and additions on the property. | Land | Improvement |
|---|---|---|---|---|
| 2025 | $4,788 | $394,566 | $62,037 | $332,529 |
| 2023 | $4,788 | $379,246 | $59,629 | $319,617 |
| 2022 | $4,637 | $371,810 | $58,460 | $313,350 |
| 2021 | $4,500 | $364,520 | $57,314 | $307,206 |
| 2020 | $4,334 | $360,783 | $56,727 | $304,056 |
| 2019 | $4,208 | $353,710 | $55,615 | $298,095 |
| 2018 | $4,170 | $346,775 | $54,525 | $292,250 |
| 2017 | $3,868 | $339,976 | $53,456 | $286,520 |
| 2016 | $3,689 | $333,310 | $52,408 | $280,902 |
| 2015 | -- | $328,304 | $51,621 | $276,683 |
| 2014 | -- | $321,874 | $50,610 | $271,264 |
Source: Public Records
Map
Nearby Homes
- 201 E Sherman St
- 700 Blair Ave
- 21 E 7th St
- 21 E 7th St Unit 1
- 631 Paulin Ave
- 415 E 3rd St
- 618 E 5th St Unit B
- 618 E 5th St Unit A-B
- 419 E 3rd St
- 510 E 3rd St
- 810 E 6th St
- 817 E 6th St
- 1061 Heber Ave
- 1070 Heber Ave
- 0 California 98
- 711 N Preston Dr
- 737 Renaud Ct
- 0 Avenida de Oro
- 816 Beach Ave
- 38 Las Flores Dr
Your Personal Tour Guide
Ask me questions while you tour the home.