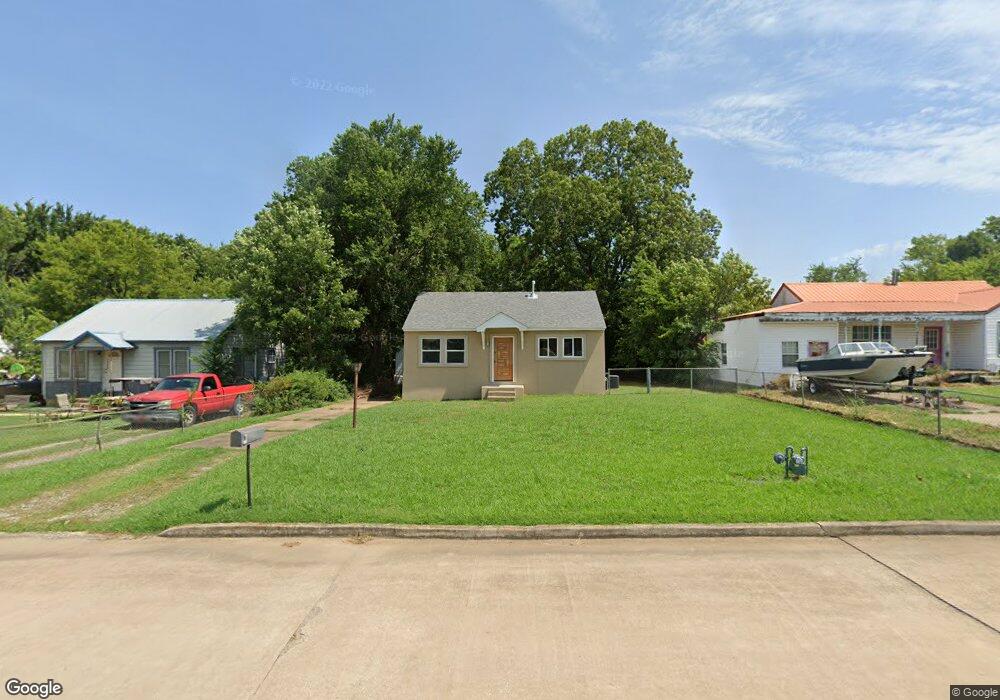
318 E 9th St Claremore, OK 74017
Estimated Value: $97,000 - $171,000
2
Beds
1
Bath
960
Sq Ft
$151/Sq Ft
Est. Value
About This Home
This home is located at 318 E 9th St, Claremore, OK 74017 and is currently estimated at $144,564, approximately $150 per square foot. 318 E 9th St is a home located in Rogers County with nearby schools including Claremont Elementary School, Will Rogers Junior High School, and Claremore High School.
Ownership History
Date
Name
Owned For
Owner Type
Purchase Details
Closed on
Nov 28, 2023
Sold by
Larosa Miguel A and Larosa Cynthia
Bought by
Cradup Lauren Elizabeth
Current Estimated Value
Home Financials for this Owner
Home Financials are based on the most recent Mortgage that was taken out on this home.
Original Mortgage
$5,137
Outstanding Balance
$5,035
Interest Rate
7.76%
Mortgage Type
New Conventional
Estimated Equity
$139,529
Purchase Details
Closed on
Nov 21, 2023
Sold by
D R Horton Texas Ltd
Bought by
Miller Scott and Miller Kimberly
Home Financials for this Owner
Home Financials are based on the most recent Mortgage that was taken out on this home.
Original Mortgage
$5,137
Outstanding Balance
$5,035
Interest Rate
7.76%
Mortgage Type
New Conventional
Estimated Equity
$139,529
Purchase Details
Closed on
Jul 15, 1992
Sold by
Watson Lester R
Create a Home Valuation Report for This Property
The Home Valuation Report is an in-depth analysis detailing your home's value as well as a comparison with similar homes in the area
Home Values in the Area
Average Home Value in this Area
Purchase History
| Date | Buyer | Sale Price | Title Company |
|---|---|---|---|
| Cradup Lauren Elizabeth | $149,500 | None Listed On Document | |
| Miller Scott | $293,500 | Dhi Title | |
| -- | $26,500 | -- |
Source: Public Records
Mortgage History
| Date | Status | Borrower | Loan Amount |
|---|---|---|---|
| Open | Cradup Lauren Elizabeth | $5,137 | |
| Open | Cradup Lauren Elizabeth | $146,791 | |
| Open | Miller Scott | $247,496 |
Source: Public Records
Tax History
| Year | Tax Paid | Tax Assessment Tax Assessment Total Assessment is a certain percentage of the fair market value that is determined by local assessors to be the total taxable value of land and additions on the property. | Land | Improvement |
|---|---|---|---|---|
| 2025 | $1,467 | $15,867 | $7,920 | $7,947 |
| 2024 | $1,524 | $16,485 | $7,920 | $8,565 |
| 2023 | $1,524 | $4,215 | $2,053 | $2,162 |
| 2022 | $398 | $4,302 | $2,053 | $2,249 |
| 2021 | $678 | $8,060 | $2,042 | $6,018 |
| 2020 | $290 | $3,212 | $1,802 | $1,410 |
| 2019 | $279 | $3,016 | $1,802 | $1,214 |
| 2018 | $281 | $3,038 | $1,802 | $1,236 |
| 2017 | $277 | $3,020 | $1,802 | $1,218 |
| 2016 | $84 | $2,899 | $1,512 | $1,387 |
| 2015 | $83 | $2,898 | $1,416 | $1,482 |
| 2014 | $83 | $2,898 | $1,384 | $1,514 |
Source: Public Records
Map
Nearby Homes
- 607 E 11th St
- 601 E 11th St
- 402 E 6th St
- 403 N Choctaw Ave
- 520 E 6th St
- 104 W 7th St
- 1114 N Osage Ave
- 817 E 11th St
- 821 E 11th St
- 509 N Weenonah Ave
- 704 N Sioux Ave
- 1317 N Mcfarland Place
- 110 E 13th Place
- 614 E 5th St
- 2925 E Holly Rd
- 125 E Powell St
- 212 N Lavira Ave
- 314 W 7th St
- 221 N Dorothy Ave
- 1137 N Oklahoma Ave
Your Personal Tour Guide
Ask me questions while you tour the home.