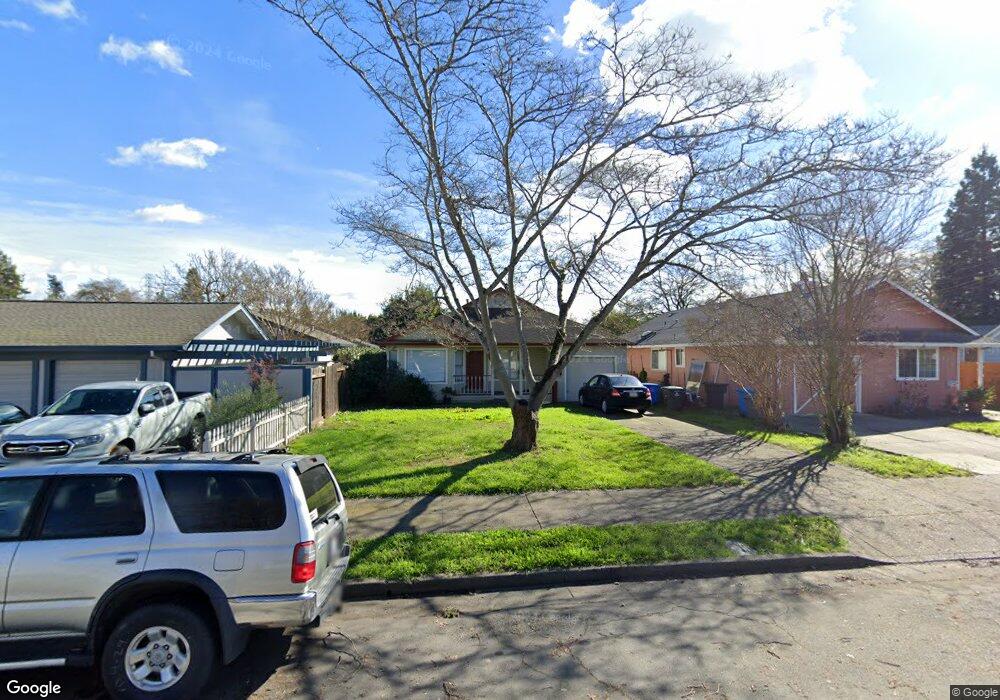
318 Hewett St Santa Rosa, CA 95401
Historic Railroad Square NeighborhoodEstimated Value: $510,000 - $584,000
2
Beds
2
Baths
1,164
Sq Ft
$471/Sq Ft
Est. Value
About This Home
This home is located at 318 Hewett St, Santa Rosa, CA 95401 and is currently estimated at $548,220, approximately $470 per square foot. 318 Hewett St is a home located in Sonoma County with nearby schools including Abraham Lincoln Elementary School, Santa Rosa Middle School, and Santa Rosa High School.
Ownership History
Date
Name
Owned For
Owner Type
Purchase Details
Closed on
May 14, 2010
Sold by
Bartolomei Gina L
Bought by
Bartolomei Paul A
Current Estimated Value
Home Financials for this Owner
Home Financials are based on the most recent Mortgage that was taken out on this home.
Original Mortgage
$150,000
Outstanding Balance
$100,490
Interest Rate
5.04%
Mortgage Type
Seller Take Back
Estimated Equity
$447,730
Purchase Details
Closed on
Nov 9, 2005
Sold by
Bartolomei Dennis D and Bartolomei Carol
Bought by
Bartolomei Dennis D and Bartolomei Carol
Create a Home Valuation Report for This Property
The Home Valuation Report is an in-depth analysis detailing your home's value as well as a comparison with similar homes in the area
Home Values in the Area
Average Home Value in this Area
Purchase History
| Date | Buyer | Sale Price | Title Company |
|---|---|---|---|
| Bartolomei Paul A | $150,000 | None Available | |
| Bartolomei Dennis D | $300,000 | North Bay Title Co |
Source: Public Records
Mortgage History
| Date | Status | Borrower | Loan Amount |
|---|---|---|---|
| Open | Bartolomei Paul A | $150,000 |
Source: Public Records
Tax History Compared to Growth
Tax History
| Year | Tax Paid | Tax Assessment Tax Assessment Total Assessment is a certain percentage of the fair market value that is determined by local assessors to be the total taxable value of land and additions on the property. | Land | Improvement |
|---|---|---|---|---|
| 2025 | $3,544 | $311,786 | $116,888 | $194,898 |
| 2024 | $3,544 | $305,674 | $114,597 | $191,077 |
| 2023 | $3,544 | $299,681 | $112,350 | $187,331 |
| 2022 | $3,274 | $293,806 | $110,148 | $183,658 |
| 2021 | $3,235 | $288,046 | $107,989 | $180,057 |
| 2020 | $3,227 | $285,093 | $106,882 | $178,211 |
| 2019 | $3,210 | $279,504 | $104,787 | $174,717 |
| 2018 | $3,193 | $274,025 | $102,733 | $171,292 |
| 2017 | $3,136 | $268,653 | $100,719 | $167,934 |
| 2016 | $3,108 | $263,387 | $98,745 | $164,642 |
| 2015 | $3,017 | $259,431 | $97,262 | $162,169 |
| 2014 | $2,833 | $254,350 | $95,357 | $158,993 |
Source: Public Records
Map
Nearby Homes