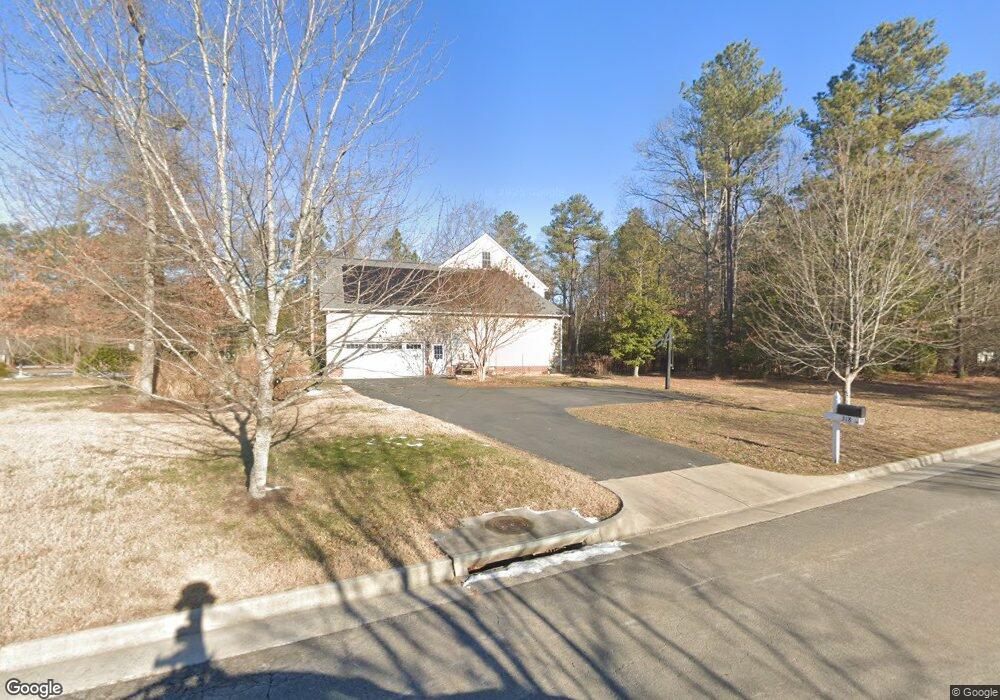
318 Hillsway Dr Ashland, VA 23005
Estimated Value: $652,000 - $758,000
5
Beds
4
Baths
3,180
Sq Ft
$226/Sq Ft
Est. Value
About This Home
This home is located at 318 Hillsway Dr, Ashland, VA 23005 and is currently estimated at $719,161, approximately $226 per square foot. 318 Hillsway Dr is a home located in Hanover County with nearby schools including Henry Clay Elementary School, Liberty Middle School, and Patrick Henry High School.
Ownership History
Date
Name
Owned For
Owner Type
Purchase Details
Closed on
Aug 24, 2011
Sold by
J D Goodman Builder Inc
Bought by
Merrill Timothy W
Current Estimated Value
Home Financials for this Owner
Home Financials are based on the most recent Mortgage that was taken out on this home.
Original Mortgage
$319,960
Outstanding Balance
$221,019
Interest Rate
4.52%
Mortgage Type
New Conventional
Estimated Equity
$498,142
Purchase Details
Closed on
Oct 6, 2010
Sold by
Rogers Chenault Inc
Bought by
J D Goodman Builder Inc
Create a Home Valuation Report for This Property
The Home Valuation Report is an in-depth analysis detailing your home's value as well as a comparison with similar homes in the area
Home Values in the Area
Average Home Value in this Area
Purchase History
| Date | Buyer | Sale Price | Title Company |
|---|---|---|---|
| Merrill Timothy W | $399,950 | -- | |
| J D Goodman Builder Inc | $220,000 | -- |
Source: Public Records
Mortgage History
| Date | Status | Borrower | Loan Amount |
|---|---|---|---|
| Open | Merrill Timothy W | $319,960 |
Source: Public Records
Tax History Compared to Growth
Tax History
| Year | Tax Paid | Tax Assessment Tax Assessment Total Assessment is a certain percentage of the fair market value that is determined by local assessors to be the total taxable value of land and additions on the property. | Land | Improvement |
|---|---|---|---|---|
| 2025 | $5,092 | $628,700 | $135,000 | $493,700 |
| 2024 | $4,565 | $563,600 | $125,000 | $438,600 |
| 2023 | $4,340 | $563,600 | $125,000 | $438,600 |
| 2022 | $4,081 | $503,800 | $120,000 | $383,800 |
| 2021 | $3,980 | $491,400 | $120,000 | $371,400 |
| 2020 | $3,736 | $461,200 | $120,000 | $341,200 |
| 2019 | $3,265 | $442,400 | $120,000 | $322,400 |
| 2018 | $3,265 | $403,100 | $105,000 | $298,100 |
| 2017 | $3,265 | $403,100 | $105,000 | $298,100 |
| 2016 | $3,265 | $403,100 | $105,000 | $298,100 |
| 2015 | $3,265 | $403,100 | $105,000 | $298,100 |
| 2014 | $3,249 | $401,100 | $105,000 | $296,100 |
Source: Public Records
Map
Nearby Homes
- 720 Chapman St
- 118 Lauradell Rd
- 509 Chapman St
- 119 Thorncliff Rd
- Jefferson Plan at Amburn - Single Family
- Byrd Plan at Amburn - Villas
- Monterey Plan at Amburn - Single Family
- 317 N Snead St
- 109 Axton Ln
- 124 Axton Ln
- 210 Wesley St
- 0 Wesley St Unit 2431424
- 513 Wesley St
- 205 Henry Clay Rd
- 405 Thompson St
- 11182 Tinsley Dr
- 0 E Patrick St
- 11228 Hill Ridge Ct
- 11224 Hill Ridge Ct
- 10520 Orchard Blossom Dr