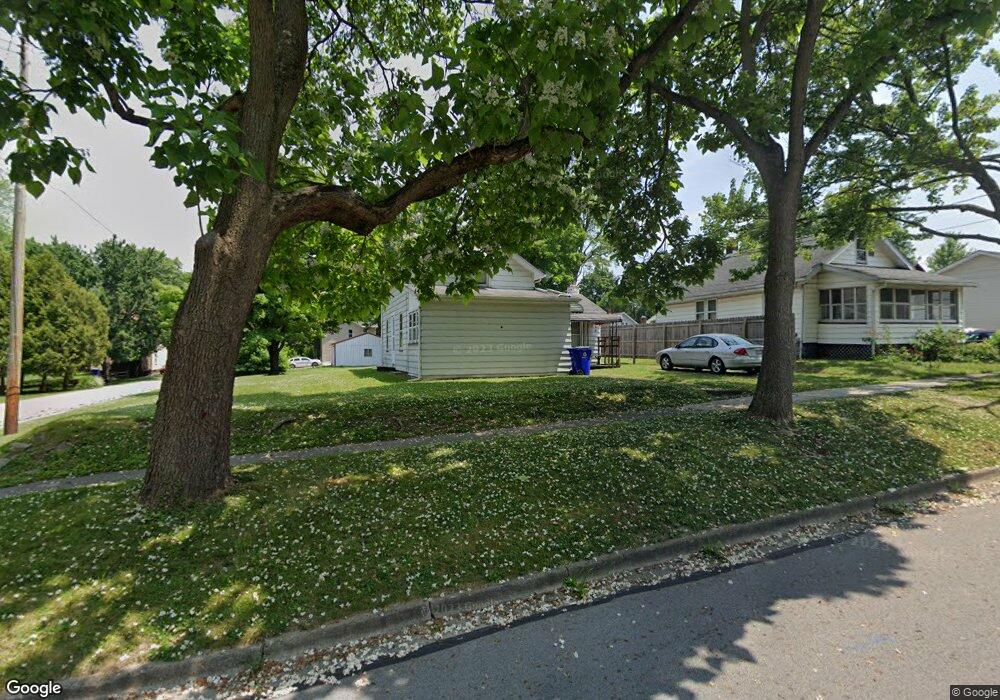
318 N Walnut St Ravenna, OH 44266
Estimated Value: $89,724 - $148,000
4
Beds
1
Bath
958
Sq Ft
$119/Sq Ft
Est. Value
About This Home
This home is located at 318 N Walnut St, Ravenna, OH 44266 and is currently estimated at $113,681, approximately $118 per square foot. 318 N Walnut St is a home located in Portage County with nearby schools including The Academy at Nola Dunn, West Park Elementary School, and Tarrant County J J A E P.
Ownership History
Date
Name
Owned For
Owner Type
Purchase Details
Closed on
Feb 11, 2004
Sold by
Cmar Joan M
Bought by
Cmar John R and Cmar Joan M
Current Estimated Value
Purchase Details
Closed on
Aug 15, 1989
Bought by
Cmar Joan M
Create a Home Valuation Report for This Property
The Home Valuation Report is an in-depth analysis detailing your home's value as well as a comparison with similar homes in the area
Home Values in the Area
Average Home Value in this Area
Purchase History
| Date | Buyer | Sale Price | Title Company |
|---|---|---|---|
| Cmar John R | -- | -- | |
| Cmar Joan M | -- | -- |
Source: Public Records
Tax History Compared to Growth
Tax History
| Year | Tax Paid | Tax Assessment Tax Assessment Total Assessment is a certain percentage of the fair market value that is determined by local assessors to be the total taxable value of land and additions on the property. | Land | Improvement |
|---|---|---|---|---|
| 2024 | $521 | $27,620 | $4,830 | $22,790 |
| 2023 | $427 | $20,510 | $4,830 | $15,680 |
| 2022 | $428 | $20,510 | $4,830 | $15,680 |
| 2021 | $429 | $20,510 | $4,830 | $15,680 |
| 2020 | $412 | $17,890 | $4,830 | $13,060 |
| 2019 | $413 | $17,890 | $4,830 | $13,060 |
| 2018 | $500 | $18,550 | $5,530 | $13,020 |
| 2017 | $500 | $18,550 | $5,530 | $13,020 |
| 2016 | $441 | $18,550 | $5,530 | $13,020 |
| 2015 | $442 | $18,550 | $5,530 | $13,020 |
| 2014 | $527 | $20,270 | $6,130 | $14,140 |
| 2013 | $521 | $20,270 | $6,130 | $14,140 |
Source: Public Records
Map
Nearby Homes
- 170 N Prospect St
- 502 N Chestnut St
- 242 W Highland Ave
- 550 Washington Ave
- 241 Myrtle St
- 168 E Riddle Ave
- 435 Lincoln St
- 159 E Harris Ave
- 420 Woodland St
- 646 W Highland Ave
- 656 W Highland Ave
- 825 W Highland Ave
- 607 King St
- 312 Bryn Mawr St
- 447 S Diamond St
- 426 Jefferson St
- 401 Madison St
- 628 S Diamond St
- 0 Sumner St
- 6942 State Route 44