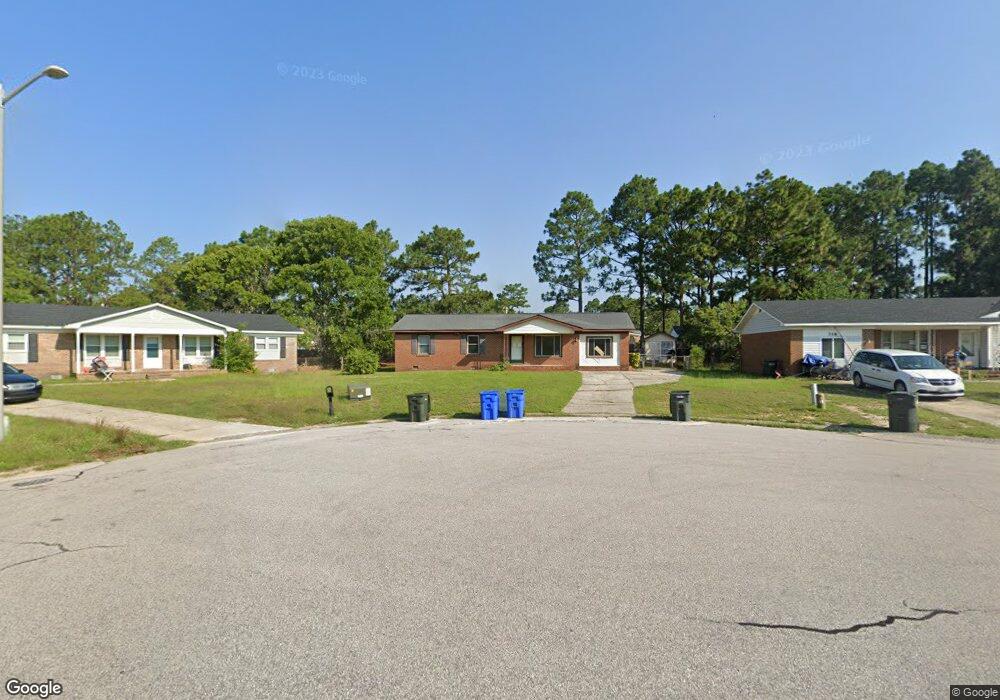
318 Nugget Ct Fayetteville, NC 28311
Kings Grant NeighborhoodEstimated Value: $148,000 - $165,000
3
Beds
2
Baths
1,430
Sq Ft
$110/Sq Ft
Est. Value
About This Home
This home is located at 318 Nugget Ct, Fayetteville, NC 28311 and is currently estimated at $156,807, approximately $109 per square foot. 318 Nugget Ct is a home located in Cumberland County with nearby schools including College Lakes Elementary, Spring Lake Middle, and E. E. Smith High School.
Ownership History
Date
Name
Owned For
Owner Type
Purchase Details
Closed on
Mar 22, 2024
Sold by
Midfirst Bank
Bought by
Olive Branch Capital Llc
Current Estimated Value
Purchase Details
Closed on
Jan 24, 2024
Sold by
Llg Trustee Llc
Bought by
Midfirst Bank and Cummings
Purchase Details
Closed on
Dec 23, 2011
Sold by
Cummings Edna S
Bought by
Cummings Edna S
Home Financials for this Owner
Home Financials are based on the most recent Mortgage that was taken out on this home.
Original Mortgage
$93,596
Interest Rate
4.75%
Mortgage Type
FHA
Create a Home Valuation Report for This Property
The Home Valuation Report is an in-depth analysis detailing your home's value as well as a comparison with similar homes in the area
Home Values in the Area
Average Home Value in this Area
Purchase History
| Date | Buyer | Sale Price | Title Company |
|---|---|---|---|
| Olive Branch Capital Llc | $135,000 | None Listed On Document | |
| Olive Branch Capital Llc | $135,000 | None Listed On Document | |
| Midfirst Bank | $111,500 | None Listed On Document | |
| Cummings Edna S | -- | -- |
Source: Public Records
Mortgage History
| Date | Status | Borrower | Loan Amount |
|---|---|---|---|
| Previous Owner | Cummings Edna S | $93,596 |
Source: Public Records
Tax History Compared to Growth
Tax History
| Year | Tax Paid | Tax Assessment Tax Assessment Total Assessment is a certain percentage of the fair market value that is determined by local assessors to be the total taxable value of land and additions on the property. | Land | Improvement |
|---|---|---|---|---|
| 2024 | $2,131 | $80,388 | $12,000 | $68,388 |
| 2023 | $1,399 | $80,388 | $12,000 | $68,388 |
| 2022 | $1,210 | $80,388 | $12,000 | $68,388 |
| 2021 | $1,210 | $80,388 | $12,000 | $68,388 |
| 2019 | $1,175 | $66,000 | $12,000 | $54,000 |
| 2018 | $1,175 | $66,000 | $12,000 | $54,000 |
| 2017 | $1,072 | $66,000 | $12,000 | $54,000 |
| 2016 | $1,213 | $86,800 | $12,000 | $74,800 |
| 2015 | $1,201 | $86,800 | $12,000 | $74,800 |
| 2014 | $1,194 | $86,800 | $12,000 | $74,800 |
Source: Public Records
Map
Nearby Homes