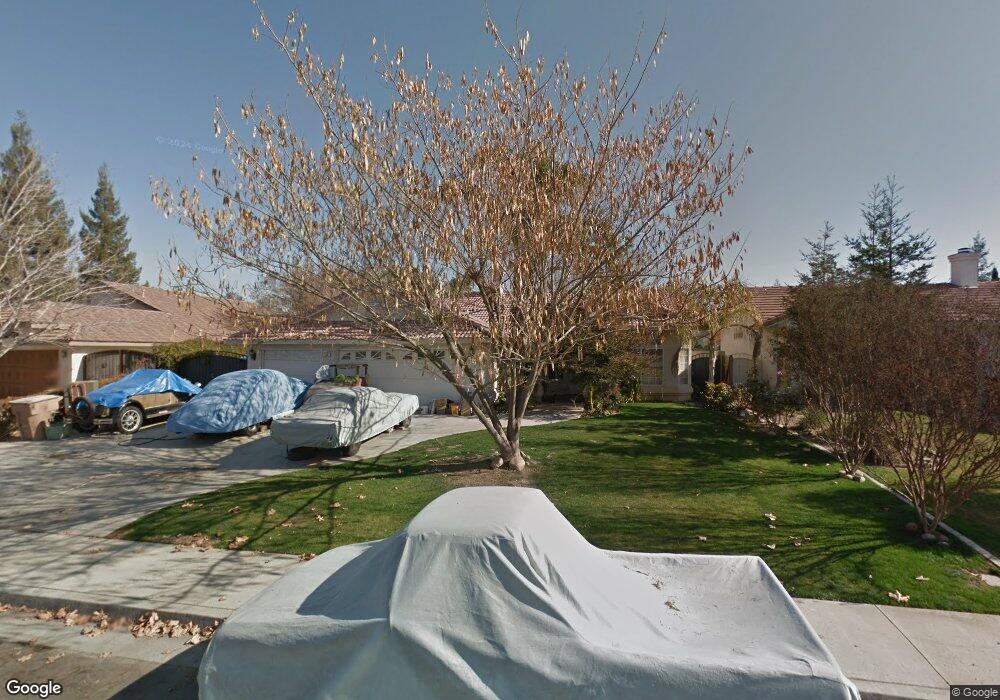
318 Portola Ct Bakersfield, CA 93314
Estimated Value: $421,000 - $447,000
3
Beds
2
Baths
1,723
Sq Ft
$251/Sq Ft
Est. Value
About This Home
This home is located at 318 Portola Ct, Bakersfield, CA 93314 and is currently estimated at $432,678, approximately $251 per square foot. 318 Portola Ct is a home located in Kern County with nearby schools including Del Rio Elementary School, Rosedale Middle School, and Liberty High School.
Ownership History
Date
Name
Owned For
Owner Type
Purchase Details
Closed on
Dec 16, 1997
Sold by
Hud
Bought by
Mcdowell Timothy R and Mcdowell Deborah H
Current Estimated Value
Home Financials for this Owner
Home Financials are based on the most recent Mortgage that was taken out on this home.
Original Mortgage
$126,953
Interest Rate
6.98%
Mortgage Type
FHA
Purchase Details
Closed on
Jul 24, 1997
Sold by
Norwest Mtg Inc
Bought by
Hud
Purchase Details
Closed on
Jun 11, 1997
Sold by
Cea Mauricio and Cea Anna
Bought by
Norwest Mtg Inc
Purchase Details
Closed on
Dec 7, 1994
Sold by
Vaughn Wayne
Bought by
Cea Mauricio and Cea Anna
Home Financials for this Owner
Home Financials are based on the most recent Mortgage that was taken out on this home.
Original Mortgage
$136,810
Interest Rate
9.2%
Mortgage Type
FHA
Create a Home Valuation Report for This Property
The Home Valuation Report is an in-depth analysis detailing your home's value as well as a comparison with similar homes in the area
Home Values in the Area
Average Home Value in this Area
Purchase History
| Date | Buyer | Sale Price | Title Company |
|---|---|---|---|
| Mcdowell Timothy R | $128,000 | Commonwealth Land Title Ins | |
| Hud | -- | Fidelity National Title Ins | |
| Norwest Mtg Inc | $157,887 | Fidelity National Title Ins | |
| Cea Mauricio | $139,000 | First American Title Ins Co |
Source: Public Records
Mortgage History
| Date | Status | Borrower | Loan Amount |
|---|---|---|---|
| Previous Owner | Mcdowell Timothy R | $126,953 | |
| Previous Owner | Cea Mauricio | $136,810 |
Source: Public Records
Tax History Compared to Growth
Tax History
| Year | Tax Paid | Tax Assessment Tax Assessment Total Assessment is a certain percentage of the fair market value that is determined by local assessors to be the total taxable value of land and additions on the property. | Land | Improvement |
|---|---|---|---|---|
| 2025 | $3,658 | $204,355 | $55,869 | $148,486 |
| 2024 | $3,574 | $200,349 | $54,774 | $145,575 |
| 2023 | $3,574 | $196,421 | $53,700 | $142,721 |
| 2022 | $3,499 | $192,571 | $52,648 | $139,923 |
| 2021 | $3,367 | $188,796 | $51,616 | $137,180 |
| 2020 | $3,301 | $186,861 | $51,087 | $135,774 |
| 2019 | $3,242 | $186,861 | $51,087 | $135,774 |
| 2018 | $3,171 | $179,606 | $49,104 | $130,502 |
| 2017 | $3,120 | $176,086 | $48,142 | $127,944 |
| 2016 | $2,972 | $172,635 | $47,199 | $125,436 |
| 2015 | $2,921 | $170,043 | $46,491 | $123,552 |
| 2014 | $2,857 | $166,713 | $45,581 | $121,132 |
Source: Public Records
Map
Nearby Homes
- 306 Portola Ct
- 13904 Las Entradas
- 14008 Las Entradas
- 14016 Las Entradas
- 13506 Morocco Ave
- 201 El Paso Rd
- 304 Calle Lechuga
- 1215 Brookline Ln
- 14308 San Jose Ave
- 205 Calle Avenida
- 13900 San Lazaro Ave
- 14004 San Lazaro Ave
- 118 Emerald Isle Way
- 601 Las Arenas Ct
- 309 Sonoma Vine Ct
- 501 Reed St
- 15829 Cole Brook Ct
- 14616 Tralee Dr
- 13408 Frenchglen Ave
- 314 Portola Ct
- 322 Portola Ct
- 310 Portola Ct
- 315 Portola Ct
- 323 Portola Ct
- 313 Portola Ct
- 13608 Arbolado Ct
- 311 Portola Ct
- 13706 Via Contento
- 13702 Via Contento
- 13800 Via Contento
- 13615 San Simeon Ave
- 13804 Via Contento
- 302 Portola Ct
- 322 Via Rosario
- 307 Portola Ct
- 320 Via Rosario
- 330 Via Rosario
- 303 Portola Ct
- 13808 Via Contento