Estimated Value: $109,000 - $136,000
10
Beds
3
Baths
3,960
Sq Ft
$31/Sq Ft
Est. Value
About This Home
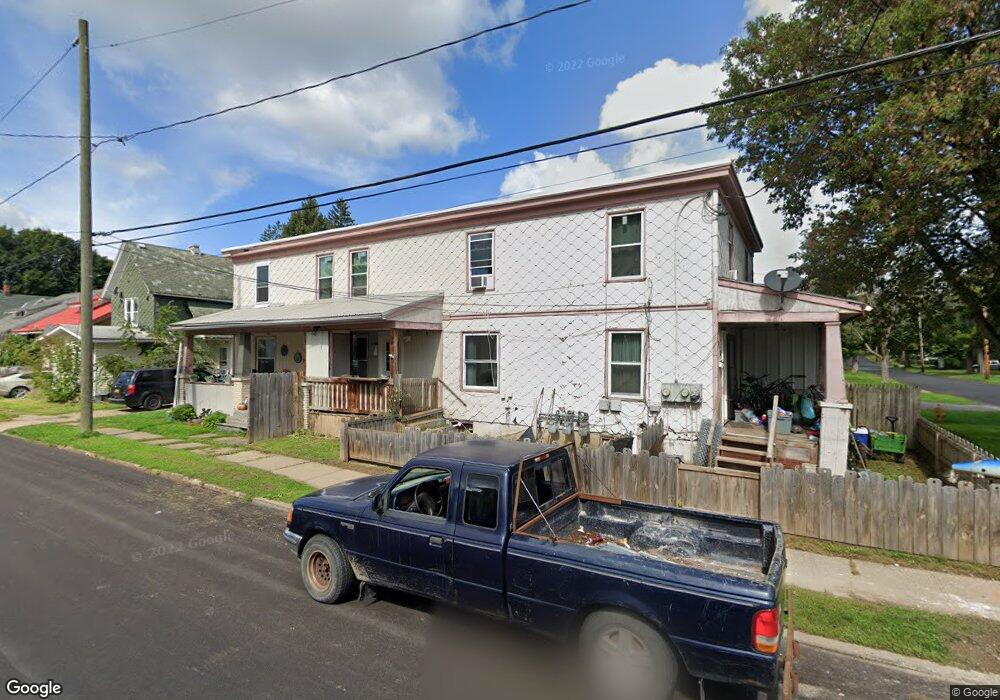
This home is located at 318 S 2nd St, Olean, NY 14760 and is currently estimated at $123,000, approximately $31 per square foot. 318 S 2nd St is a home located in Cattaraugus County with nearby schools including Olean Intermediate-Middle School, Olean Senior High School, and New Life Christian School.
Ownership History
Date
Name
Owned For
Owner Type
Purchase Details
Closed on
Feb 14, 2014
Sold by
Smith Thomas C
Bought by
Jcac Rentals Llc
Current Estimated Value
Home Financials for this Owner
Home Financials are based on the most recent Mortgage that was taken out on this home.
Original Mortgage
$281,000
Outstanding Balance
$77,721
Interest Rate
3.55%
Mortgage Type
Purchase Money Mortgage
Estimated Equity
$45,279
Purchase Details
Closed on
Nov 20, 2009
Sold by
Bayview Loan Servicing Llc
Bought by
Smith Thomas
Purchase Details
Closed on
Jan 9, 2004
Sold by
Smith Thomas
Bought by
Roy Matthew
Purchase Details
Closed on
Apr 3, 1997
Sold by
Kondakor Imre
Bought by
Smith Thomas C
Purchase Details
Closed on
Mar 28, 1997
Sold by
Kondakor Imre
Bought by
Smith Thomas C
Create a Home Valuation Report for This Property
The Home Valuation Report is an in-depth analysis detailing your home's value as well as a comparison with similar homes in the area
Home Values in the Area
Average Home Value in this Area
Purchase History
| Date | Buyer | Sale Price | Title Company |
|---|---|---|---|
| Jcac Rentals Llc | $65,000 | Gregory Shemeld | |
| Smith Thomas | $30,000 | Nicholas Dicerbo | |
| Roy Matthew | $58,000 | Nicholas Dicerbo | |
| Smith Thomas C | $47,000 | -- | |
| Smith Thomas C | $47,000 | -- |
Source: Public Records
Mortgage History
| Date | Status | Borrower | Loan Amount |
|---|---|---|---|
| Open | Jcac Rentals Llc | $281,000 |
Source: Public Records
Tax History
| Year | Tax Paid | Tax Assessment Tax Assessment Total Assessment is a certain percentage of the fair market value that is determined by local assessors to be the total taxable value of land and additions on the property. | Land | Improvement |
|---|---|---|---|---|
| 2024 | $3,161 | $50,000 | $3,200 | $46,800 |
| 2023 | $1,882 | $50,000 | $3,200 | $46,800 |
| 2022 | $1,910 | $50,000 | $3,200 | $46,800 |
| 2021 | $1,965 | $50,000 | $3,200 | $46,800 |
| 2020 | $4,257 | $50,000 | $3,200 | $46,800 |
| 2019 | $751 | $50,000 | $3,200 | $46,800 |
| 2018 | $5,456 | $50,000 | $3,200 | $46,800 |
| 2017 | $5,086 | $50,000 | $3,200 | $46,800 |
| 2016 | $3,430 | $50,000 | $3,200 | $46,800 |
| 2015 | -- | $50,000 | $3,200 | $46,800 |
| 2014 | -- | $50,000 | $3,200 | $46,800 |
Source: Public Records
Map
Nearby Homes
Your Personal Tour Guide
Ask me questions while you tour the home.