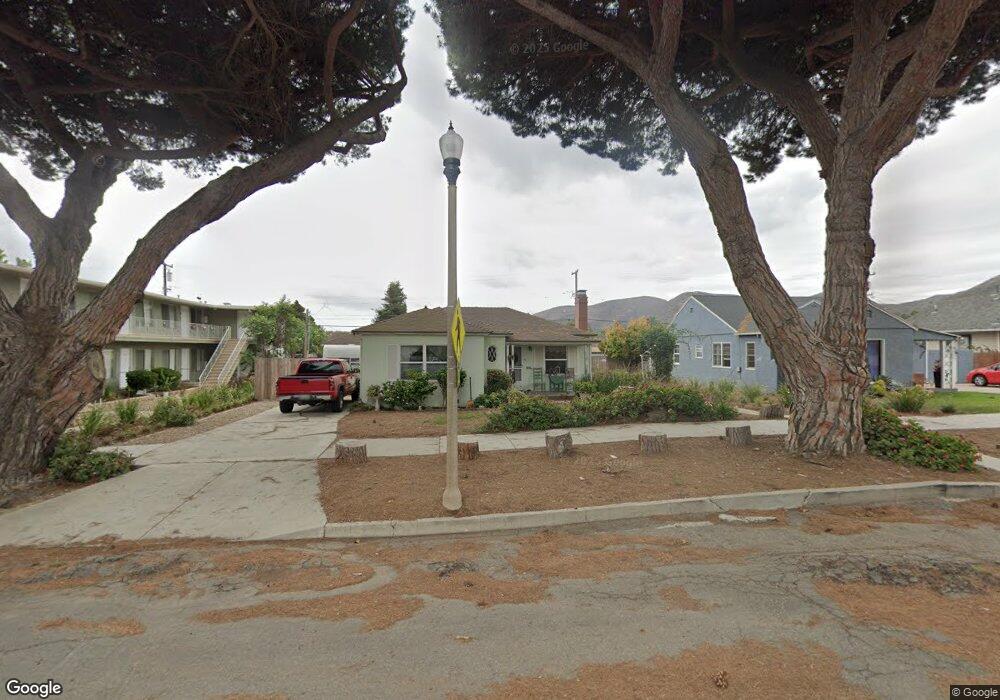
318 S H St Lompoc, CA 93436
Estimated Value: $250,000 - $716,000
Studio
--
Bath
--
Sq Ft
10,454
Sq Ft Lot
About This Home
This home is located at 318 S H St, Lompoc, CA 93436 and is currently estimated at $573,276. 318 S H St is a home located in Santa Barbara County with nearby schools including Arthur Hapgood Elementary School, Lompoc Valley Middle School, and Lompoc High School.
Ownership History
Date
Name
Owned For
Owner Type
Purchase Details
Closed on
Jan 16, 2024
Sold by
Valley View Property Investments Llc
Bought by
Patel Pankaj T and Patel Daksa P
Current Estimated Value
Purchase Details
Closed on
Jan 15, 2021
Sold by
Vienola Thomas A and Berg Jody L
Bought by
Valley View Property Investments Llc
Home Financials for this Owner
Home Financials are based on the most recent Mortgage that was taken out on this home.
Original Mortgage
$50,000
Interest Rate
3%
Mortgage Type
Commercial
Purchase Details
Closed on
Jun 3, 2015
Sold by
Vienola Thomas A and Berg Jody L
Bought by
The Vienola Credit Trust and Berg Jody L
Create a Home Valuation Report for This Property
The Home Valuation Report is an in-depth analysis detailing your home's value as well as a comparison with similar homes in the area
Home Values in the Area
Average Home Value in this Area
Purchase History
| Date | Buyer | Sale Price | Title Company |
|---|---|---|---|
| Patel Pankaj T | -- | First American Title | |
| Valley View Property Investments Llc | $4,354,000 | First American Title Company | |
| The Vienola Credit Trust | -- | None Available |
Source: Public Records
Mortgage History
| Date | Status | Borrower | Loan Amount |
|---|---|---|---|
| Previous Owner | Valley View Property Investments Llc | $50,000 |
Source: Public Records
Tax History
| Year | Tax Paid | Tax Assessment Tax Assessment Total Assessment is a certain percentage of the fair market value that is determined by local assessors to be the total taxable value of land and additions on the property. | Land | Improvement |
|---|---|---|---|---|
| 2025 | $5,645 | $519,566 | $140,716 | $378,850 |
| 2023 | $5,645 | $499,392 | $135,252 | $364,140 |
| 2022 | $5,549 | $489,600 | $132,600 | $357,000 |
| 2021 | $2,169 | $183,344 | $82,797 | $100,547 |
| 2020 | $2,147 | $181,466 | $81,949 | $99,517 |
| 2019 | $2,111 | $177,909 | $80,343 | $97,566 |
| 2018 | $2,078 | $174,421 | $78,768 | $95,653 |
| 2017 | $2,040 | $171,002 | $77,224 | $93,778 |
| 2016 | $2,004 | $167,650 | $75,710 | $91,940 |
| 2015 | $1,989 | $165,132 | $74,573 | $90,559 |
| 2014 | -- | $161,899 | $73,113 | $88,786 |
Source: Public Records
Map
Nearby Homes
Your Personal Tour Guide
Ask me questions while you tour the home.