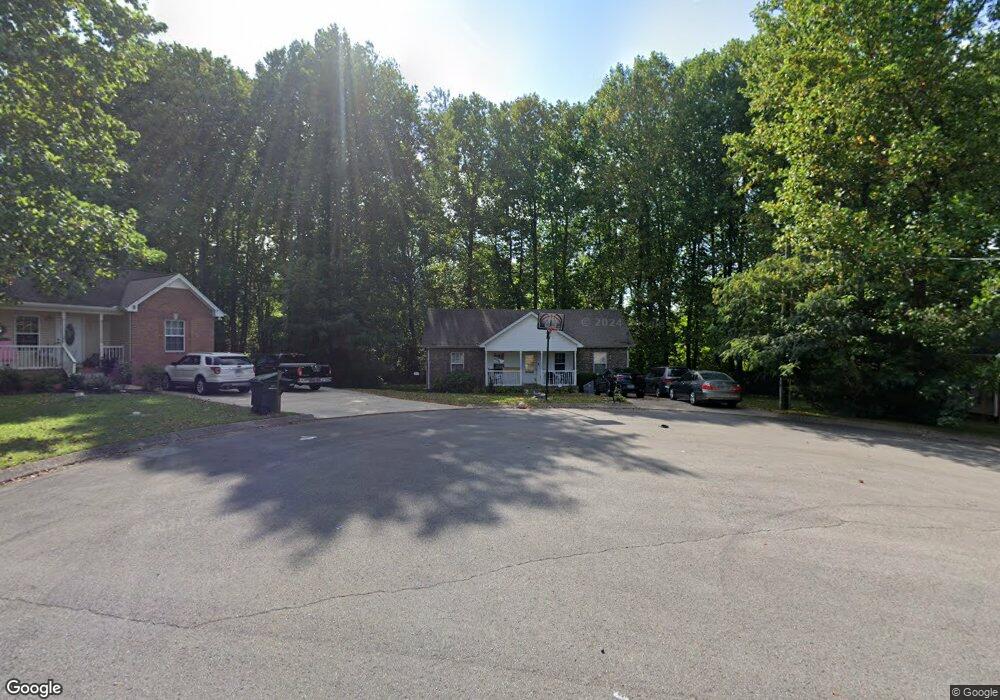
318 Silvia Ct Springfield, TN 37172
Estimated Value: $247,000 - $288,000
--
Bed
2
Baths
1,100
Sq Ft
$240/Sq Ft
Est. Value
About This Home
This home is located at 318 Silvia Ct, Springfield, TN 37172 and is currently estimated at $264,421, approximately $240 per square foot. 318 Silvia Ct is a home located in Robertson County with nearby schools including Westside Elementary School, Cheatham Park Elementary School, and Innovation Academy.
Ownership History
Date
Name
Owned For
Owner Type
Purchase Details
Closed on
Aug 15, 2008
Sold by
Hjw Builders Llc
Bought by
Stanton Essence C
Current Estimated Value
Home Financials for this Owner
Home Financials are based on the most recent Mortgage that was taken out on this home.
Original Mortgage
$117,346
Outstanding Balance
$76,562
Interest Rate
6.21%
Estimated Equity
$187,859
Purchase Details
Closed on
Sep 18, 2006
Bought by
Hjw Builders Llc
Create a Home Valuation Report for This Property
The Home Valuation Report is an in-depth analysis detailing your home's value as well as a comparison with similar homes in the area
Home Values in the Area
Average Home Value in this Area
Purchase History
| Date | Buyer | Sale Price | Title Company |
|---|---|---|---|
| Stanton Essence C | $115,000 | -- | |
| Hjw Builders Llc | $90,000 | -- |
Source: Public Records
Mortgage History
| Date | Status | Borrower | Loan Amount |
|---|---|---|---|
| Open | Hjw Builders Llc | $117,346 |
Source: Public Records
Tax History Compared to Growth
Tax History
| Year | Tax Paid | Tax Assessment Tax Assessment Total Assessment is a certain percentage of the fair market value that is determined by local assessors to be the total taxable value of land and additions on the property. | Land | Improvement |
|---|---|---|---|---|
| 2024 | -- | $51,675 | $12,500 | $39,175 |
| 2023 | $1,294 | $51,675 | $12,500 | $39,175 |
| 2022 | $1,256 | $34,425 | $6,875 | $27,550 |
| 2021 | $1,256 | $34,425 | $6,875 | $27,550 |
| 2020 | $1,256 | $34,425 | $6,875 | $27,550 |
| 2019 | $37,787 | $34,425 | $6,875 | $27,550 |
| 2018 | $1,256 | $34,425 | $6,875 | $27,550 |
| 2017 | $1,249 | $29,150 | $5,750 | $23,400 |
| 2016 | $1,249 | $29,150 | $5,750 | $23,400 |
| 2015 | $1,213 | $29,150 | $5,750 | $23,400 |
| 2014 | $1,213 | $29,150 | $5,750 | $23,400 |
Source: Public Records
Map
Nearby Homes