318 W Whatley St Pooler, GA 31322
Estimated Value: $232,000 - $282,000
3
Beds
2
Baths
1,404
Sq Ft
$179/Sq Ft
Est. Value
About This Home
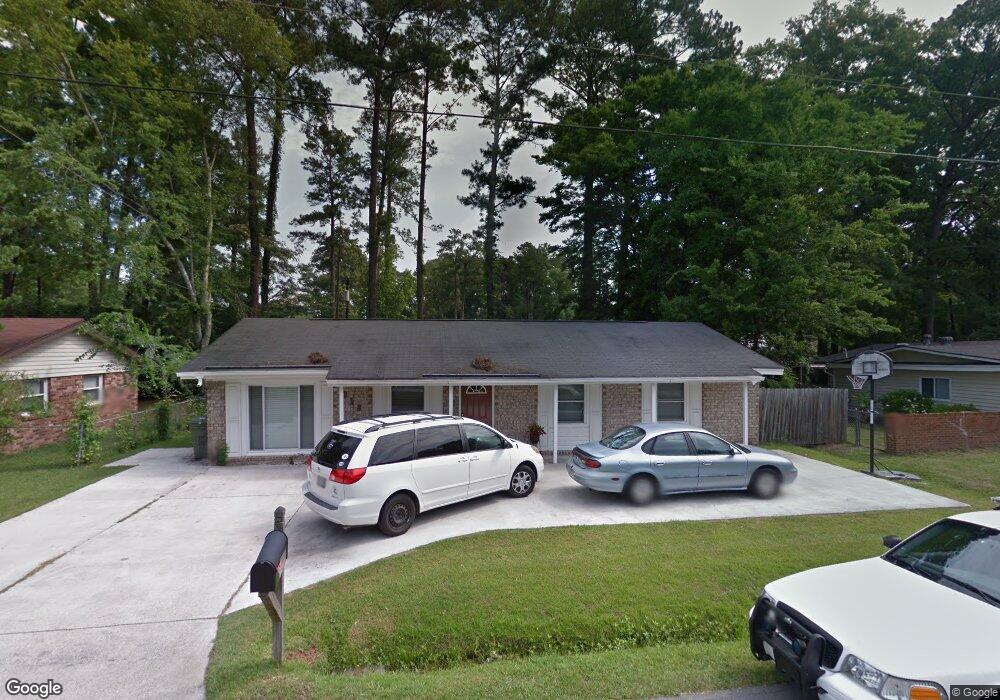
This home is located at 318 W Whatley St, Pooler, GA 31322 and is currently estimated at $251,259, approximately $178 per square foot. 318 W Whatley St is a home located in Chatham County with nearby schools including Pooler Elementary School, West Chatham Middle School, and Groves High School.
Ownership History
Date
Name
Owned For
Owner Type
Purchase Details
Closed on
Jan 1, 2018
Sold by
Holland Michael
Bought by
Grant J L Trustee and Society Unique Orchard Trust
Current Estimated Value
Purchase Details
Closed on
May 30, 2017
Sold by
Nationstar Mtg Llc
Bought by
Holland Michael
Purchase Details
Closed on
Dec 6, 2016
Sold by
James P
Bought by
Nationstar Mtg Llc
Purchase Details
Closed on
Mar 16, 2009
Sold by
Gabriel Mark L
Bought by
Barbee James P
Home Financials for this Owner
Home Financials are based on the most recent Mortgage that was taken out on this home.
Original Mortgage
$131,562
Interest Rate
5.13%
Mortgage Type
FHA
Purchase Details
Closed on
Apr 23, 2008
Sold by
Not Provided
Bought by
Barbee James P
Home Financials for this Owner
Home Financials are based on the most recent Mortgage that was taken out on this home.
Original Mortgage
$118,750
Interest Rate
5.82%
Mortgage Type
New Conventional
Create a Home Valuation Report for This Property
The Home Valuation Report is an in-depth analysis detailing your home's value as well as a comparison with similar homes in the area
Home Values in the Area
Average Home Value in this Area
Purchase History
| Date | Buyer | Sale Price | Title Company |
|---|---|---|---|
| Grant J L Trustee | -- | -- | |
| Holland Michael | $103,700 | -- | |
| Nationstar Mtg Llc | $103,700 | -- | |
| Barbee James P | $134,000 | -- | |
| Barbee James P | $125,000 | -- |
Source: Public Records
Mortgage History
| Date | Status | Borrower | Loan Amount |
|---|---|---|---|
| Previous Owner | Barbee James P | $131,562 | |
| Previous Owner | Barbee James P | $118,750 |
Source: Public Records
Tax History Compared to Growth
Tax History
| Year | Tax Paid | Tax Assessment Tax Assessment Total Assessment is a certain percentage of the fair market value that is determined by local assessors to be the total taxable value of land and additions on the property. | Land | Improvement |
|---|---|---|---|---|
| 2025 | $3,097 | $81,600 | $15,000 | $66,600 |
| 2024 | $3,097 | $81,400 | $15,000 | $66,400 |
| 2023 | $2,077 | $65,040 | $15,000 | $50,040 |
| 2022 | $1,582 | $52,120 | $10,040 | $42,080 |
| 2021 | $1,670 | $46,160 | $10,040 | $36,120 |
| 2020 | $1,470 | $41,280 | $10,040 | $31,240 |
| 2019 | $1,470 | $43,000 | $10,040 | $32,960 |
| 2018 | $1,260 | $41,480 | $9,831 | $31,649 |
| 2017 | $1,132 | $43,360 | $10,040 | $33,320 |
| 2016 | $1,132 | $40,640 | $10,040 | $30,600 |
| 2015 | $1,267 | $45,040 | $10,280 | $34,760 |
| 2014 | $1,880 | $45,240 | $0 | $0 |
Source: Public Records
Map
Nearby Homes
- 212 W Whatley St
- 116 Windrush Pines
- 0 U S 80 Unit SA344451
- 0 U S 80 Unit 322013
- 604 W Tietgen St
- 149 Danbury Ct
- 4 Oak Leaf Place
- 34 Crystal Lake Dr
- 206 Chime Creek Dr
- 25 Blues Dr
- 33 Blues Dr
- 37 Blues Dr
- 47 Blues Dr
- 1 Blues Dr
- 29 Blues Dr
- 304 E Tietgen St
- 108 Morgan St
- 407 Middleton St
- 220 Holly Ave
- 616 Rogers St
- 320 W Whatley St
- 312 W Whatley St
- W W Whatley St
- 319 W Whatley St
- 322 W Whatley St
- 322 W Whatley St
- 310 W Whatley St
- 321 W Whatley St
- 321 W Whatley St
- 309 W Whatley St
- 321 W Tietgen St
- 325 W Tietgen St
- 307 W Whatley St
- 404 W Whatley St
- 309 S Chestnut St
- 307 W Tietgen St
- 305 W Whatley St
- 312 W Tietgen St
- 312 W Tietgen St
- 405 W Tietgen St