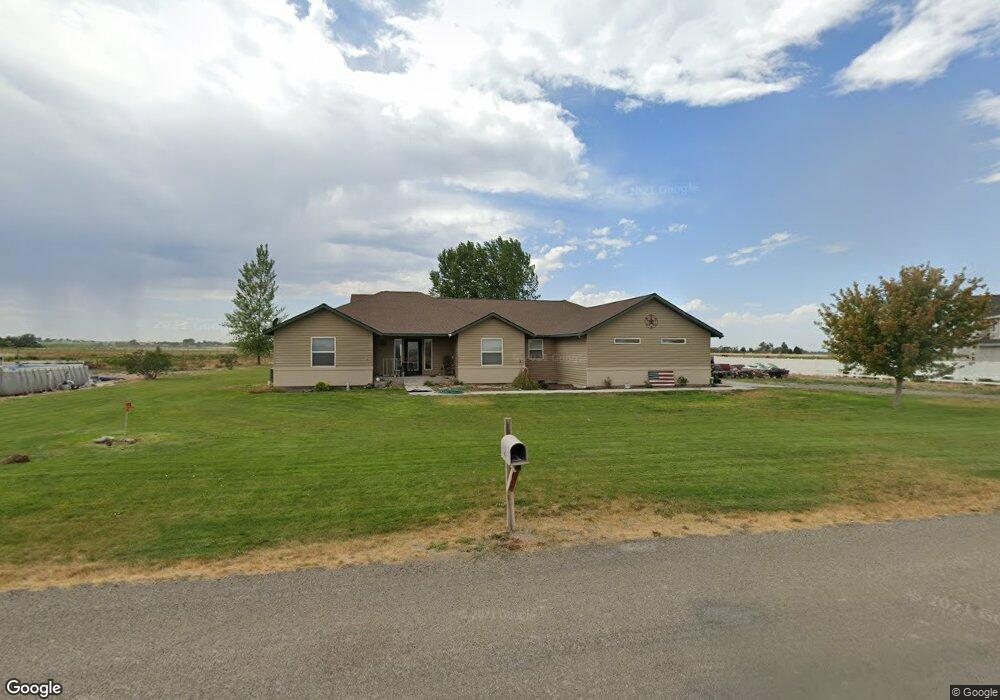
3180 E 3533 N Twin Falls, ID 83301
Estimated Value: $725,334 - $838,000
5
Beds
3
Baths
3,535
Sq Ft
$221/Sq Ft
Est. Value
About This Home
This home is located at 3180 E 3533 N, Twin Falls, ID 83301 and is currently estimated at $782,445, approximately $221 per square foot. 3180 E 3533 N is a home with nearby schools including Bickel Elementary School, South Hills Middle School, and Twin Falls Senior High School.
Ownership History
Date
Name
Owned For
Owner Type
Purchase Details
Closed on
May 26, 2006
Sold by
Deer Meadows Subdivison Llc
Bought by
Maki Craig E
Current Estimated Value
Home Financials for this Owner
Home Financials are based on the most recent Mortgage that was taken out on this home.
Original Mortgage
$61,500
Interest Rate
6.55%
Mortgage Type
Future Advance Clause Open End Mortgage
Purchase Details
Closed on
May 23, 2006
Sold by
Deer Meadows Subdivision Llc
Bought by
Maki Craig E
Home Financials for this Owner
Home Financials are based on the most recent Mortgage that was taken out on this home.
Original Mortgage
$61,500
Interest Rate
6.55%
Mortgage Type
Future Advance Clause Open End Mortgage
Purchase Details
Closed on
Oct 28, 2005
Sold by
Nielsen Michael A and Nielsen Shauna L
Bought by
Schmechel Vaughn
Purchase Details
Closed on
Jun 29, 2005
Sold by
Werner Frederick L and Werner Elizabeth A
Bought by
Grover Justin and Grover Camille
Create a Home Valuation Report for This Property
The Home Valuation Report is an in-depth analysis detailing your home's value as well as a comparison with similar homes in the area
Purchase History
We collect this data history from publicly available records. To have your information removed, we recommend requesting removal directly through your county’s website.
| Date | Buyer | Sale Price | Title Company |
|---|---|---|---|
| Maki Craig E | -- | -- | |
| Maki Craig E | -- | -- | |
| Schmechel Vaughn | -- | -- | |
| Grover Justin | -- | -- |
Source: Public Records
Mortgage History
We collect this data history from publicly available records. To have your information removed, we recommend requesting removal directly through your county’s website.
| Date | Status | Borrower | Loan Amount |
|---|---|---|---|
| Closed | Maki Craig E | $61,500 | |
| Closed | Maki Craig E | $61,500 |
Source: Public Records
Tax History
| Year | Tax Paid | Tax Assessment Tax Assessment Total Assessment is a certain percentage of the fair market value that is determined by local assessors to be the total taxable value of land and additions on the property. | Land | Improvement |
|---|---|---|---|---|
| 2025 | $2,738 | $581,179 | $116,781 | $464,398 |
| 2024 | $2,799 | $586,338 | $116,781 | $469,557 |
| 2023 | $2,396 | $555,016 | $116,781 | $438,235 |
| 2022 | $3,400 | $573,014 | $82,737 | $490,277 |
| 2021 | $3,332 | $462,736 | $75,989 | $386,747 |
| 2020 | $3,423 | $403,659 | $75,989 | $327,670 |
| 2019 | $3,904 | $422,017 | $102,447 | $319,570 |
| 2018 | $3,906 | $409,237 | $102,447 | $306,790 |
| 2017 | $3,687 | $388,777 | $102,447 | $286,330 |
| 2016 | $3,861 | $379,027 | $0 | $0 |
| 2015 | $3,897 | $379,027 | $102,447 | $276,580 |
| 2012 | -- | $320,706 | $0 | $0 |
Source: Public Records
Map
Nearby Homes
- 3567 N 3100 E
- TBD 3500 N
- 3046 E 3500 N
- 1531 Briarwood Ln
- 503 Carson Dr
- 1532 Briarwood Ln
- 2036 Harrison St S
- 2008 Harrison St S
- 2064 Harrison St S
- 503 April Ave
- 2015 Lowline Ave
- 2039 Lowline Ave
- 669 Locust St S
- 1836 Gage Ave
- 1011 Thunder Mountain St
- 971 Gregory Way
- 961 Gregory Way
- 3287 N 3137 E
- 924 Elk Butte Ave
- 1022 Trapper Peak Rd
Your Personal Tour Guide
Ask me questions while you tour the home.