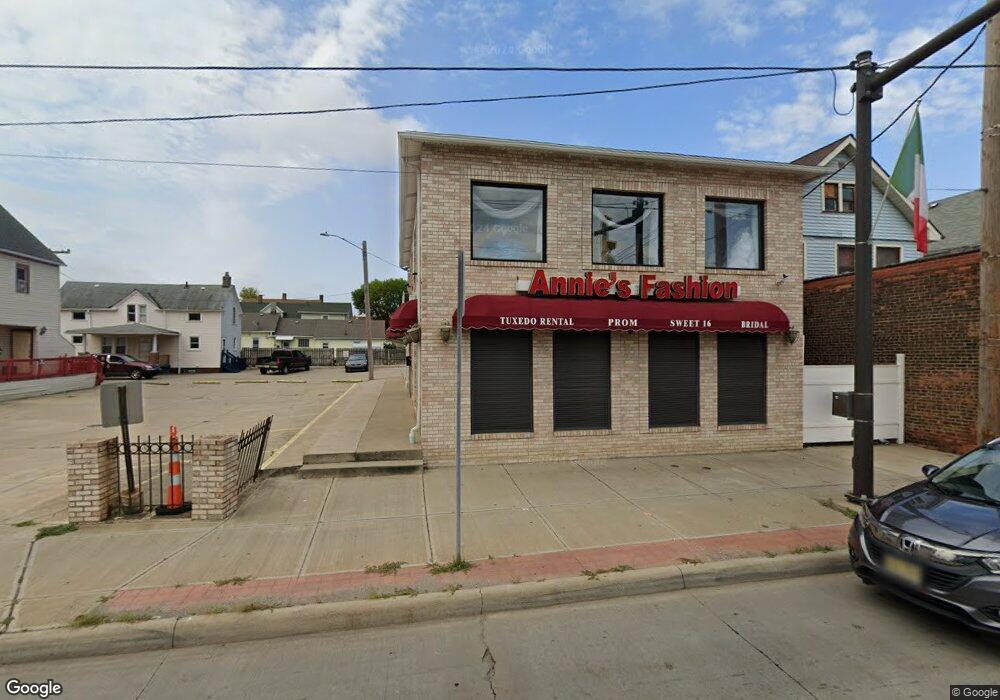
3180 Fulton Rd Cleveland, OH 44109
Clark-Fulton NeighborhoodEstimated Value: $838,081
--
Bed
2
Baths
15,290
Sq Ft
$55/Sq Ft
Est. Value
About This Home
This home is located at 3180 Fulton Rd, Cleveland, OH 44109 and is currently priced at $838,081, approximately $54 per square foot. 3180 Fulton Rd is a home located in Cuyahoga County with nearby schools including Almira Academy, Benjamin Franklin, and Anton Grdina School.
Ownership History
Date
Name
Owned For
Owner Type
Purchase Details
Closed on
Jul 18, 2005
Sold by
Monclus Juan and Monclus Juan A
Bought by
Monclus Ana H
Current Estimated Value
Home Financials for this Owner
Home Financials are based on the most recent Mortgage that was taken out on this home.
Original Mortgage
$314,803
Interest Rate
5.68%
Mortgage Type
Construction
Purchase Details
Closed on
Mar 16, 1998
Sold by
Scharfenort Fred P
Bought by
Monclus Juan and Monclus Ana
Home Financials for this Owner
Home Financials are based on the most recent Mortgage that was taken out on this home.
Original Mortgage
$32,000
Interest Rate
7%
Mortgage Type
Commercial
Purchase Details
Closed on
Aug 31, 1994
Sold by
Scharfenort Michael
Bought by
Scharfenort Fred P
Purchase Details
Closed on
May 18, 1989
Sold by
Marini Gabriel D
Bought by
Scharfenort Fred P and Scharfenort Scharfenort
Purchase Details
Closed on
Sep 8, 1975
Sold by
Dirienzo Mary A and Dirienzo Joseph
Bought by
Marini Gabriel D
Purchase Details
Closed on
Jan 1, 1975
Bought by
Dirienzo Mary A and Dirienzo Joseph
Create a Home Valuation Report for This Property
The Home Valuation Report is an in-depth analysis detailing your home's value as well as a comparison with similar homes in the area
Home Values in the Area
Average Home Value in this Area
Purchase History
| Date | Buyer | Sale Price | Title Company |
|---|---|---|---|
| Monclus Ana H | -- | Progressive Land Title Ag | |
| Monclus Juan | $40,000 | Executive Title Agency Corp | |
| Scharfenort Fred P | $19,000 | -- | |
| Scharfenort Fred P | $38,000 | -- | |
| Marini Gabriel D | $28,000 | -- | |
| Dirienzo Mary A | -- | -- |
Source: Public Records
Mortgage History
| Date | Status | Borrower | Loan Amount |
|---|---|---|---|
| Closed | Monclus Ana H | $314,803 | |
| Closed | Monclus Juan | $32,000 |
Source: Public Records
Tax History Compared to Growth
Tax History
| Year | Tax Paid | Tax Assessment Tax Assessment Total Assessment is a certain percentage of the fair market value that is determined by local assessors to be the total taxable value of land and additions on the property. | Land | Improvement |
|---|---|---|---|---|
| 2024 | $6,191 | $59,990 | $5,530 | $54,460 |
| 2023 | $5,048 | $50,540 | $5,530 | $45,010 |
| 2022 | $5,041 | $50,540 | $5,530 | $45,010 |
| 2021 | $5,055 | $50,540 | $5,530 | $45,010 |
| 2020 | $5,254 | $50,540 | $5,530 | $45,010 |
| 2019 | $5,067 | $144,400 | $15,800 | $128,600 |
| 2018 | $5,005 | $50,540 | $5,530 | $45,010 |
| 2017 | $5,174 | $50,930 | $4,870 | $46,060 |
| 2016 | $5,188 | $50,930 | $4,870 | $46,060 |
| 2015 | $5,852 | $50,930 | $4,870 | $46,060 |
| 2014 | $5,852 | $57,860 | $5,530 | $52,330 |
Source: Public Records
Map
Nearby Homes
- 3616 Newark Ave
- 3548 Trent Ave
- 3615 Trent Ave
- 3405 Roehl Ave
- 3185 W 38th St
- 3188 W 38th St
- 3219 W 33rd St
- 0 W 33rd St Unit 5103176
- 3817 Carlyle Ave
- 3129 W 31st St
- 3914 Sackett Ave
- 3107 Walton Ave
- 4131 Newark Ave
- 3116 W 30th St
- 3616 Storer Ave
- 3112 W 30th St
- 3252 W 41st St
- 4137 Cyril Ave
- 3440 Erin Ave
- 4144 Hyde Ave
- 3190 Fulton Rd
- 3190 Fulton Rd Unit 2
- 3526 Newark Ave
- 3534 Newark Ave
- 3515 Trent Ave
- 3542 Newark Ave
- 3541 Trent Ave
- 3202 Fulton Rd
- 3602 Newark Ave
- 3547 Trent Ave
- 3547 Trent Ave Unit Back
- 3547 Trent Ave Unit DWN FRNT
- 3158 Fulton Rd
- 3608 Newark Ave
- 3549 Trent 47
- 3553 Trent Ave
- 3156 Fulton Rd
- 3543 Newark Ave
- 3557 Trent Ave
- 3540 Trent Ave