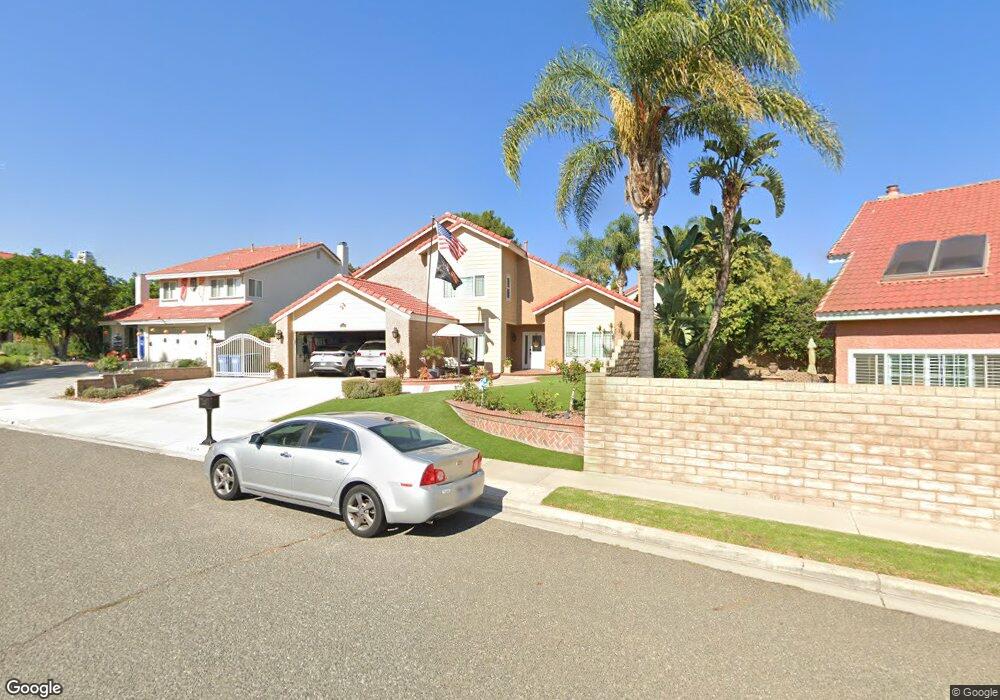
3180 Melody Ln Simi Valley, CA 93063
Central Simi Valley NeighborhoodEstimated Value: $1,009,183 - $1,249,000
4
Beds
3
Baths
2,599
Sq Ft
$424/Sq Ft
Est. Value
About This Home
This home is located at 3180 Melody Ln, Simi Valley, CA 93063 and is currently estimated at $1,103,046, approximately $424 per square foot. 3180 Melody Ln is a home located in Ventura County with nearby schools including Township Elementary School, Valley View Middle School, and Simi Valley High School.
Ownership History
Date
Name
Owned For
Owner Type
Purchase Details
Closed on
Aug 17, 2017
Sold by
Roe Michael D and Roe Vickieann
Bought by
Roe Michael D and Roe Vickieann
Current Estimated Value
Purchase Details
Closed on
Apr 30, 1998
Sold by
Theresa Zazzarino
Bought by
Roe Michael D and Roe Vickieann
Home Financials for this Owner
Home Financials are based on the most recent Mortgage that was taken out on this home.
Original Mortgage
$240,000
Outstanding Balance
$46,690
Interest Rate
7.05%
Estimated Equity
$1,056,356
Purchase Details
Closed on
Dec 18, 1994
Sold by
Zazzarino Nicholas and Zazzarino Theresa
Bought by
Roe Michael D and Roe Vickie Ann
Purchase Details
Closed on
Sep 3, 1993
Sold by
Severns Tedford E and Severns Nancy K
Bought by
Zazzarino Nicholas and Zazzarino Theresa
Home Financials for this Owner
Home Financials are based on the most recent Mortgage that was taken out on this home.
Original Mortgage
$276,750
Interest Rate
4.5%
Create a Home Valuation Report for This Property
The Home Valuation Report is an in-depth analysis detailing your home's value as well as a comparison with similar homes in the area
Home Values in the Area
Average Home Value in this Area
Purchase History
| Date | Buyer | Sale Price | Title Company |
|---|---|---|---|
| Roe Michael D | -- | None Available | |
| Roe Michael D | $80,000 | United Title Company | |
| Roe Michael D | -- | -- | |
| Zazzarino Nicholas | $307,500 | Lincoln Title Co |
Source: Public Records
Mortgage History
| Date | Status | Borrower | Loan Amount |
|---|---|---|---|
| Open | Roe Michael D | $240,000 | |
| Previous Owner | Zazzarino Nicholas | $276,750 |
Source: Public Records
Tax History Compared to Growth
Tax History
| Year | Tax Paid | Tax Assessment Tax Assessment Total Assessment is a certain percentage of the fair market value that is determined by local assessors to be the total taxable value of land and additions on the property. | Land | Improvement |
|---|---|---|---|---|
| 2025 | $6,678 | $536,166 | $210,832 | $325,334 |
| 2024 | $6,678 | $525,653 | $206,698 | $318,955 |
| 2023 | $6,290 | $515,347 | $202,646 | $312,701 |
| 2022 | $6,268 | $505,243 | $198,673 | $306,570 |
| 2021 | $6,225 | $495,337 | $194,778 | $300,559 |
| 2020 | $6,010 | $481,961 | $192,782 | $289,179 |
| 2019 | $5,745 | $472,511 | $189,002 | $283,509 |
| 2018 | $5,699 | $463,247 | $185,297 | $277,950 |
| 2017 | $5,576 | $454,164 | $181,664 | $272,500 |
| 2016 | $5,334 | $445,259 | $178,102 | $267,157 |
| 2015 | $5,227 | $438,573 | $175,428 | $263,145 |
| 2014 | $5,156 | $429,985 | $171,993 | $257,992 |
Source: Public Records
Map
Nearby Homes
- 3160 Leslie Ct
- 3445 Presidio Ct
- 3298 Wisdom Ct
- 3262 Avenida Simi
- 2885 Circle View Dr
- 3265 Sheri Dr
- 2842 Topaz Ave
- 3060 Bianca Cir
- 2848 Jadestone Ave
- 3954 Stell Dr
- 3941 Walnut Ave
- 3049 Reservoir Dr
- 2877 Avenida Simi
- 3037 Divernon Ave
- 3560 Monticello Ave
- 3474 Highwood Ct Unit 80
- 2753 Deerwood Ave
- 3434 Highwood Ct Unit 183
- 2439 Lita Place
- 2514 Glenhurst Ct
- 3186 Melody Ln
- 3175 Patty Ct
- 3185 Patty Ct
- 3532 Township Ave
- 3548 Township Ave
- 3192 Melody Ln
- 3516 Township Ave
- 3179 Melody Ln
- 3167 Melody Ln
- 3564 Township Ave
- 3500 Township Ave
- 3195 Patty Ct
- 3189 Melody Ln
- 3166 Melody Ln
- 3155 Melody Ln
- 3580 Township Ave
- 3186 Patty Ct
- 3190 Penney Dr
- 3176 Patty Ct
- 3191 Penney Dr