3181 Court St Memphis, TN 38134
Estimated Value: $175,000 - $224,000
2
Beds
2
Baths
1,486
Sq Ft
$137/Sq Ft
Est. Value
About This Home
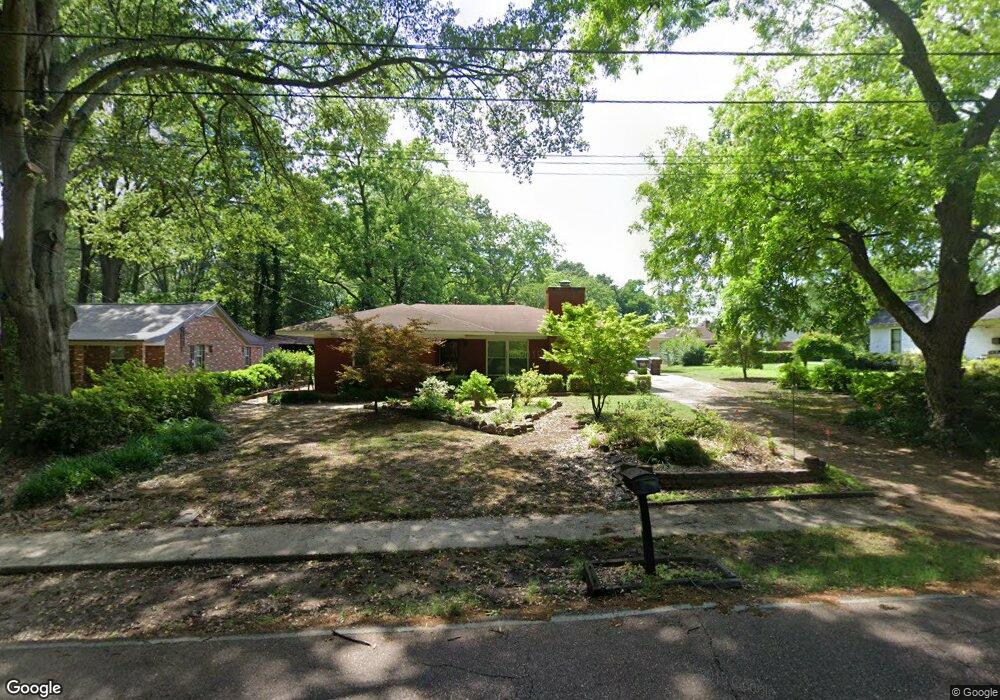
This home is located at 3181 Court St, Memphis, TN 38134 and is currently estimated at $204,268, approximately $137 per square foot. 3181 Court St is a home located in Shelby County with nearby schools including Bartlett Elementary School, Elmore Park Middle School, and Bartlett High School.
Ownership History
Date
Name
Owned For
Owner Type
Purchase Details
Closed on
Sep 2, 2016
Sold by
Droke Joseph Wayne
Bought by
Droke Joseph Wayne and Droke Mary Frances
Current Estimated Value
Purchase Details
Closed on
Aug 29, 2016
Sold by
Droke Joseph Wayne
Bought by
Droke Joseph Wayne and Droke Mary Frances
Purchase Details
Closed on
Dec 31, 1997
Sold by
Varner Eileen and Varner Eilene
Bought by
Droke Joseph Wayne
Home Financials for this Owner
Home Financials are based on the most recent Mortgage that was taken out on this home.
Original Mortgage
$60,000
Outstanding Balance
$10,432
Interest Rate
7.16%
Estimated Equity
$193,836
Purchase Details
Closed on
Dec 30, 1997
Sold by
Wassenberg Martha and Wassenberg Sam
Bought by
Droke Joseph Wayne
Home Financials for this Owner
Home Financials are based on the most recent Mortgage that was taken out on this home.
Original Mortgage
$60,000
Outstanding Balance
$10,432
Interest Rate
7.16%
Estimated Equity
$193,836
Create a Home Valuation Report for This Property
The Home Valuation Report is an in-depth analysis detailing your home's value as well as a comparison with similar homes in the area
Home Values in the Area
Average Home Value in this Area
Purchase History
| Date | Buyer | Sale Price | Title Company |
|---|---|---|---|
| Droke Joseph Wayne | -- | None Available | |
| Droke Joseph Wayne | -- | None Available | |
| Droke Joseph Wayne | -- | -- | |
| Droke Joseph Wayne | $89,000 | -- |
Source: Public Records
Mortgage History
| Date | Status | Borrower | Loan Amount |
|---|---|---|---|
| Open | Droke Joseph Wayne | $60,000 | |
| Closed | Droke Joseph Wayne | $60,000 |
Source: Public Records
Tax History Compared to Growth
Tax History
| Year | Tax Paid | Tax Assessment Tax Assessment Total Assessment is a certain percentage of the fair market value that is determined by local assessors to be the total taxable value of land and additions on the property. | Land | Improvement |
|---|---|---|---|---|
| 2025 | $1,167 | $40,575 | $12,250 | $28,325 |
| 2024 | $1,167 | $34,425 | $10,400 | $24,025 |
| 2023 | $1,763 | $34,425 | $10,400 | $24,025 |
| 2022 | $1,763 | $34,425 | $10,400 | $24,025 |
| 2021 | $1,790 | $34,425 | $10,400 | $24,025 |
| 2020 | $1,424 | $24,225 | $8,875 | $15,350 |
| 2019 | $1,424 | $24,225 | $8,875 | $15,350 |
| 2018 | $1,424 | $24,225 | $8,875 | $15,350 |
| 2017 | $996 | $24,225 | $8,875 | $15,350 |
| 2016 | $999 | $22,850 | $0 | $0 |
| 2014 | $999 | $22,850 | $0 | $0 |
Source: Public Records
Map
Nearby Homes
- 0 Blackwell St
- 3157 Rosebay Ln
- 3311 Galvin Cove
- 3292 Sycamore View Rd
- 3288 Dwain Cove
- 2935 Court St
- 2934 Shelby St
- 0 Old Brownsville Rd Unit 10174206
- 3252 Old Brownsville Rd
- 1970 Court St
- 5934 Pamela Ann Dr S
- 5601 Yale Rd
- 5482 Craigmont Dr
- 3427 Robins Roost
- 3060 Ruskin Rd
- 5259 Stage Rd
- 3356 Coachouse Cove
- 3388 Lord Dunmore Cove
- 0 Bartlett Blvd Unit 10203764
- 0 Bartlett Blvd Unit 10203763