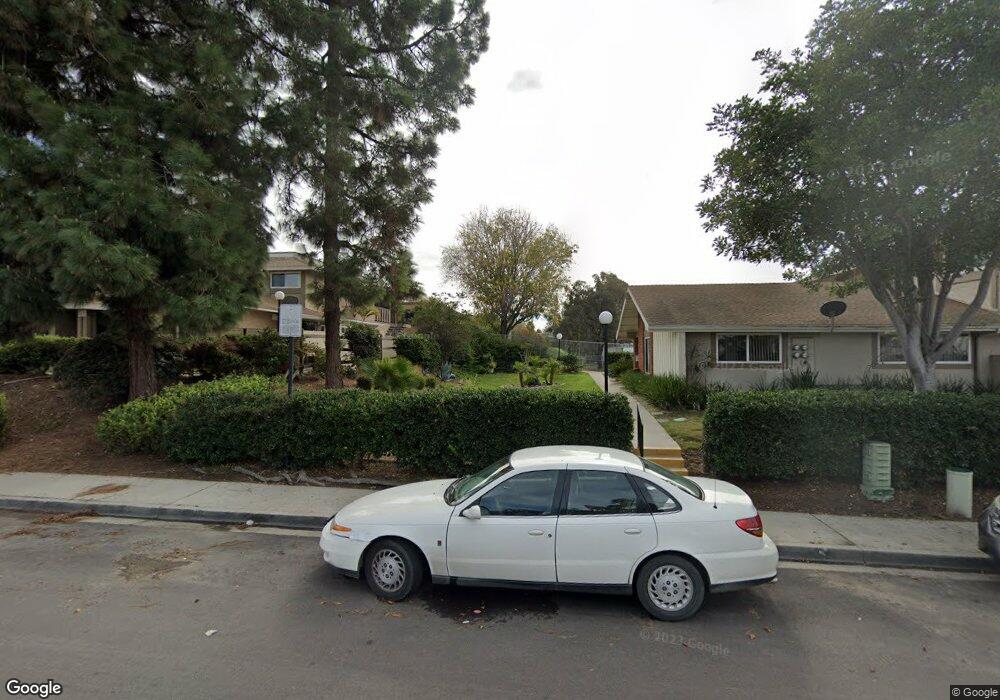
3181 Via Tonga San Diego, CA 92154
Otay Mesa West NeighborhoodEstimated Value: $450,310 - $488,000
2
Beds
1
Bath
933
Sq Ft
$502/Sq Ft
Est. Value
About This Home
This home is located at 3181 Via Tonga, San Diego, CA 92154 and is currently estimated at $468,078, approximately $501 per square foot. 3181 Via Tonga is a home located in San Diego County with nearby schools including Howard Pence Elementary School, Montgomery Middle School, and Montgomery Senior High School.
Ownership History
Date
Name
Owned For
Owner Type
Purchase Details
Closed on
Nov 30, 2015
Sold by
Quiros Gloria Elizabeth
Bought by
Castaneda Miguel A
Current Estimated Value
Home Financials for this Owner
Home Financials are based on the most recent Mortgage that was taken out on this home.
Original Mortgage
$108,000
Outstanding Balance
$84,774
Interest Rate
3.73%
Mortgage Type
New Conventional
Estimated Equity
$383,304
Purchase Details
Closed on
Oct 28, 2015
Sold by
Franklin David Victor
Bought by
Castaneda Miguel A and Castaneda Miguel
Home Financials for this Owner
Home Financials are based on the most recent Mortgage that was taken out on this home.
Original Mortgage
$108,000
Outstanding Balance
$84,774
Interest Rate
3.73%
Mortgage Type
New Conventional
Estimated Equity
$383,304
Purchase Details
Closed on
Feb 5, 2001
Sold by
Trevino Ubaldo
Bought by
Trevino Ubaldo
Purchase Details
Closed on
Mar 4, 1999
Sold by
Trevino Josefina R
Bought by
Trevino Ubaldo
Create a Home Valuation Report for This Property
The Home Valuation Report is an in-depth analysis detailing your home's value as well as a comparison with similar homes in the area
Home Values in the Area
Average Home Value in this Area
Purchase History
| Date | Buyer | Sale Price | Title Company |
|---|---|---|---|
| Castaneda Miguel A | -- | First American Title Company | |
| Castaneda Miguel A | $120,000 | First American Title Company | |
| Trevino Ubaldo | -- | -- | |
| Trevino Ubaldo | -- | -- |
Source: Public Records
Mortgage History
| Date | Status | Borrower | Loan Amount |
|---|---|---|---|
| Open | Castaneda Miguel A | $108,000 |
Source: Public Records
Tax History Compared to Growth
Tax History
| Year | Tax Paid | Tax Assessment Tax Assessment Total Assessment is a certain percentage of the fair market value that is determined by local assessors to be the total taxable value of land and additions on the property. | Land | Improvement |
|---|---|---|---|---|
| 2025 | $2,461 | $213,078 | $106,539 | $106,539 |
| 2024 | $2,461 | $208,900 | $104,450 | $104,450 |
| 2023 | $2,442 | $200,790 | $100,395 | $100,395 |
| 2022 | $2,396 | $200,790 | $100,395 | $100,395 |
| 2021 | $2,322 | $196,854 | $98,427 | $98,427 |
| 2020 | $2,268 | $194,836 | $97,418 | $97,418 |
| 2019 | $2,267 | $191,016 | $95,508 | $95,508 |
| 2018 | $2,229 | $187,272 | $93,636 | $93,636 |
| 2017 | $2,183 | $183,600 | $91,800 | $91,800 |
| 2016 | $2,108 | $180,000 | $90,000 | $90,000 |
| 2015 | $979 | $81,203 | $23,879 | $57,324 |
| 2014 | $964 | $79,614 | $23,412 | $56,202 |
Source: Public Records
Map
Nearby Homes
- 768 Picador Blvd
- 3124 Caminito Quixote
- 3206 Caminito Quixote
- 1011 Beyer Way Unit 32
- 3470 Robb Roy Place
- 1029 Reef Dr
- 3443 Alonquin Way
- 3340 Del Sol Blvd Unit 268
- 3340 Del Sol Blvd Unit 144
- 3340 Del Sol Blvd Unit SPC 126
- 3340 Del Sol Blvd Unit 125
- 3340 Del Sol Blvd Unit 111
- 3340 Del Sol Blvd Unit 196
- 3340 Del Sol Blvd Unit 198
- 3340 Del Sol Blvd Unit 227
- 3340 Del Sol Blvd Unit 117
- 3340 Del Sol Blvd Unit 21
- 3340 Del Sol Blvd Unit 237
- 3340 Del Sol Blvd Unit 97
- 856 Orchid Way
- 882 Picador Blvd
- 862 Picador Blvd
- 3205 Via Tonga Unit 18F
- 851 Via Tonga Ct Unit 14F
- 3287 Via Tonga
- 3283 Via Tonga
- 3285 Via Tonga Unit 35C
- 3267 Via Tonga
- 3245 Via Tonga
- 3223 Via Tonga
- 3225 Via Tonga
- 3177 Via Tonga
- 896 Picador Blvd
- 852 Via Tonga Ct
- 3243 Via Tonga
- 3201 Via Tonga
- 3281 Via Tonga Unit 33A
- 3247 Via Tonga
- 898 Picador Blvd
- 3179 Via Tonga