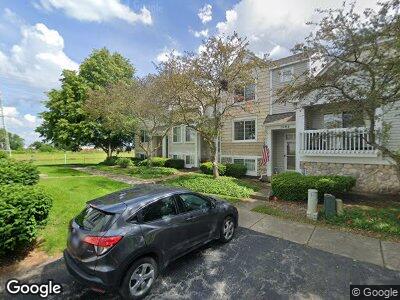
3184 Ketch Ct Unit 583 Aurora, IL 60503
Far Southeast NeighborhoodEstimated Value: $236,482 - $286,000
--
Bed
1
Bath
1,417
Sq Ft
$189/Sq Ft
Est. Value
About This Home
This home is located at 3184 Ketch Ct Unit 583, Aurora, IL 60503 and is currently estimated at $267,494, approximately $188 per square foot. 3184 Ketch Ct Unit 583 is a home located in Will County with nearby schools including Homestead Elementary School, Murphy Junior High School, and Oswego East High School.
Ownership History
Date
Name
Owned For
Owner Type
Purchase Details
Closed on
Sep 26, 2003
Sold by
Abudayeh Vivian
Bought by
Sullivan Robert
Current Estimated Value
Home Financials for this Owner
Home Financials are based on the most recent Mortgage that was taken out on this home.
Original Mortgage
$147,440
Outstanding Balance
$72,409
Interest Rate
6.4%
Mortgage Type
FHA
Estimated Equity
$195,085
Purchase Details
Closed on
Jun 15, 2002
Sold by
Patrickus James D and Patrickus Samantha C
Bought by
Abudayeh Vivian
Home Financials for this Owner
Home Financials are based on the most recent Mortgage that was taken out on this home.
Original Mortgage
$140,150
Interest Rate
6.4%
Mortgage Type
FHA
Purchase Details
Closed on
Feb 18, 2000
Sold by
Pulte Home Corp
Bought by
Patrickus James D and Defilippis Samantha C
Home Financials for this Owner
Home Financials are based on the most recent Mortgage that was taken out on this home.
Original Mortgage
$126,150
Interest Rate
8.21%
Mortgage Type
FHA
Create a Home Valuation Report for This Property
The Home Valuation Report is an in-depth analysis detailing your home's value as well as a comparison with similar homes in the area
Home Values in the Area
Average Home Value in this Area
Purchase History
| Date | Buyer | Sale Price | Title Company |
|---|---|---|---|
| Sullivan Robert | $152,000 | First American Title | |
| Abudayeh Vivian | $144,500 | -- | |
| Patrickus James D | $130,500 | -- |
Source: Public Records
Mortgage History
| Date | Status | Borrower | Loan Amount |
|---|---|---|---|
| Closed | Sullivan Robert | $0 | |
| Closed | Sullivan Robert | $42,283 | |
| Closed | Sullivan Robert R | $29,000 | |
| Open | Sullivan Robert | $147,440 | |
| Previous Owner | Abudayeh Vivian | $140,150 | |
| Previous Owner | Patrickus James D | $126,150 | |
| Previous Owner | Patrickus James D | $126,150 |
Source: Public Records
Tax History Compared to Growth
Tax History
| Year | Tax Paid | Tax Assessment Tax Assessment Total Assessment is a certain percentage of the fair market value that is determined by local assessors to be the total taxable value of land and additions on the property. | Land | Improvement |
|---|---|---|---|---|
| 2023 | $2,280 | $63,741 | $9,930 | $53,811 |
| 2022 | $4,448 | $55,699 | $9,393 | $46,306 |
| 2021 | $3,246 | $53,047 | $8,946 | $44,101 |
| 2020 | $3,161 | $52,206 | $8,804 | $43,402 |
| 2019 | $3,293 | $50,735 | $8,556 | $42,179 |
| 2018 | $3,409 | $44,228 | $8,368 | $35,860 |
| 2017 | $3,448 | $43,086 | $8,152 | $34,934 |
| 2016 | $3,538 | $42,159 | $7,977 | $34,182 |
| 2015 | $2,795 | $40,537 | $7,670 | $32,867 |
| 2014 | $2,795 | $32,790 | $7,670 | $25,120 |
| 2013 | $2,795 | $32,790 | $7,670 | $25,120 |
Source: Public Records
Map
Nearby Homes
- 3147 Cambria Ct Unit 474
- 2125 Union Mill Dr Unit 1
- 1704 Middlebury Dr Unit 302
- 1722 Middlebury Dr Unit 315
- 10S154 Schoger Dr
- 1631 Tara Belle Pkwy
- 1660 Normantown Rd Unit 438
- 3025 Diane Dr
- 2665 Tiffany St
- 2136 Colonial St Unit 1
- 4120 Idlewild Ln
- 4404 Monroe Ct
- 2836 Hillcrest Cir
- 1323 Middlebury Dr
- 2747 Hillsboro Blvd Unit 3
- 2967 Madison Dr
- 1435 Bangor Ln
- 2675 Dorothy Dr
- 2808 Edgebrook Ct
- 2753 Lansdale St
- 3186 Ketch Ct Unit 584
- 3184 Ketch Ct Unit 583
- 3182 Ketch Ct Unit 582
- 3183 Teal Bay Ct Unit 526
- 3192 Ketch Ct Unit 593
- 3190 Ketch Ct Unit 592
- 3188 Ketch Ct
- 3194 Ketch Ct Unit 594
- 3177 Teal Bay Ct Unit 533B
- 3175 Teal Bay Ct Unit 534
- 3179 Teal Bay Ct Unit 532
- 3181 Teal Bay Ct
- 3189 Teal Bay Ct Unit 523
- 3187 Teal Bay Ct Unit 524
- 3171 Teal Bay Ct
- 3191 Teal Bay Ct Unit 522
- 3185 Teal Bay Ct
- 3181 Teal Bay Ct Unit 3181
- 1928 Middlebury Dr Unit 574
- 1926 Middlebury Dr Unit 6