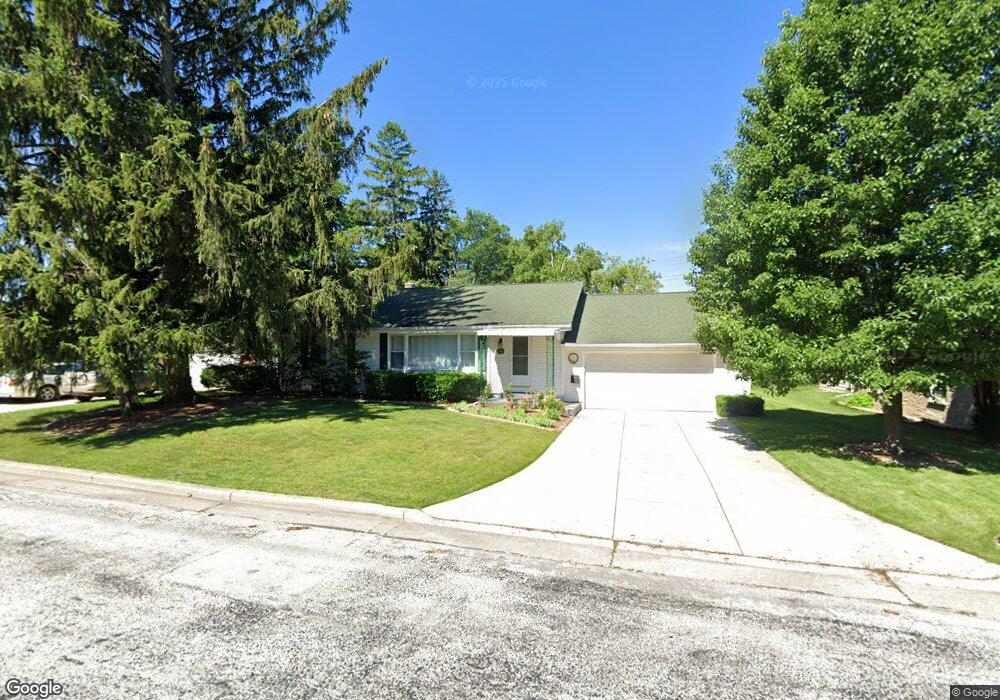
3185 N Knoll Blvd Milwaukee, WI 53222
Estimated Value: $337,000 - $430,000
3
Beds
1
Bath
1,120
Sq Ft
$322/Sq Ft
Est. Value
About This Home
This home is located at 3185 N Knoll Blvd, Milwaukee, WI 53222 and is currently estimated at $361,064, approximately $322 per square foot. 3185 N Knoll Blvd is a home located in Milwaukee County with nearby schools including Eisenhower Elementary School, Whitman Middle School, and West High School.
Ownership History
Date
Name
Owned For
Owner Type
Purchase Details
Closed on
Aug 24, 2017
Sold by
Mccrory Richard and Cording Marie
Bought by
Sheahan Jacob
Current Estimated Value
Home Financials for this Owner
Home Financials are based on the most recent Mortgage that was taken out on this home.
Original Mortgage
$218,400
Outstanding Balance
$117,087
Interest Rate
4.03%
Estimated Equity
$243,977
Purchase Details
Closed on
Aug 28, 2008
Sold by
Oberneder David P and Oberneder Sarah E
Bought by
Mccrory Richard and Cording Marie
Home Financials for this Owner
Home Financials are based on the most recent Mortgage that was taken out on this home.
Original Mortgage
$208,550
Interest Rate
6.54%
Purchase Details
Closed on
Oct 31, 2000
Sold by
Hanson Steven Gary
Bought by
Oberneder David P and Oberneder Sarah E
Home Financials for this Owner
Home Financials are based on the most recent Mortgage that was taken out on this home.
Original Mortgage
$96,000
Interest Rate
7.91%
Create a Home Valuation Report for This Property
The Home Valuation Report is an in-depth analysis detailing your home's value as well as a comparison with similar homes in the area
Home Values in the Area
Average Home Value in this Area
Purchase History
| Date | Buyer | Sale Price | Title Company |
|---|---|---|---|
| Sheahan Jacob | $229,900 | None Available | |
| Mccrory Richard | $215,000 | None Available | |
| Oberneder David P | $120,000 | -- |
Source: Public Records
Mortgage History
| Date | Status | Borrower | Loan Amount |
|---|---|---|---|
| Open | Sheahan Jacob | $218,400 | |
| Previous Owner | Mccrory Richard | $208,550 | |
| Previous Owner | Oberneder David P | $96,000 |
Source: Public Records
Tax History Compared to Growth
Tax History
| Year | Tax Paid | Tax Assessment Tax Assessment Total Assessment is a certain percentage of the fair market value that is determined by local assessors to be the total taxable value of land and additions on the property. | Land | Improvement |
|---|---|---|---|---|
| 2024 | $4,739 | $221,100 | $85,100 | $136,000 |
| 2023 | $4,449 | $221,100 | $85,100 | $136,000 |
| 2022 | $4,566 | $221,100 | $85,100 | $136,000 |
| 2021 | $4,339 | $221,100 | $85,100 | $136,000 |
| 2020 | $4,660 | $221,100 | $85,100 | $136,000 |
| 2019 | $4,704 | $221,100 | $85,100 | $136,000 |
| 2018 | $4,341 | $190,400 | $64,200 | $126,200 |
| 2017 | $4,345 | $190,400 | $64,200 | $126,200 |
| 2016 | $4,345 | $190,400 | $64,200 | $126,200 |
| 2015 | $4,300 | $190,400 | $64,200 | $126,200 |
| 2014 | $4,307 | $190,400 | $64,200 | $126,200 |
| 2013 | $4,357 | $190,400 | $64,200 | $126,200 |
Source: Public Records
Map
Nearby Homes
- 3183 N 106th St
- 3354 N 99th St
- 10615 W Woodward Ave
- 9805 W Tower View Blvd
- 3250 N 96th St
- 3715 N 98th St
- 3279 N 95th St
- 10319 W Melvina St
- 3260 N 95th St
- 10560 W Grantosa Dr
- 10363 W Woodward Ave
- 3900 N 107th St
- 3251 N 94th St
- 10708 W York Place
- 3739 N 97th Place
- 3425 N 95th St
- 2925 N 120th St
- 3275 N 93rd St
- 9544 W Lorraine Place
- 9707 W Metcalf Place
- 3191 N Knoll Blvd
- 3177 N Knoll Blvd
- 3190 N Mayfair Rd
- 3178 N Mayfair Rd
- 3182 N Knoll Blvd
- 3167 N Knoll Blvd
- 3190 N Knoll Blvd
- 3176 N Knoll Blvd
- 3168 N Mayfair Rd
- 3157 N Knoll Blvd
- 10710 W Auer Ave
- 3164 N Knoll Blvd
- 10607 W Auer Ave
- 3158 N Mayfair Rd
- 3171 N 106th St
- 3204 N Knoll Blvd
- 3206 N Mayfair Rd
- 3149 N Knoll Blvd
- 3150 N Knoll Blvd
- 3161 N 106th St