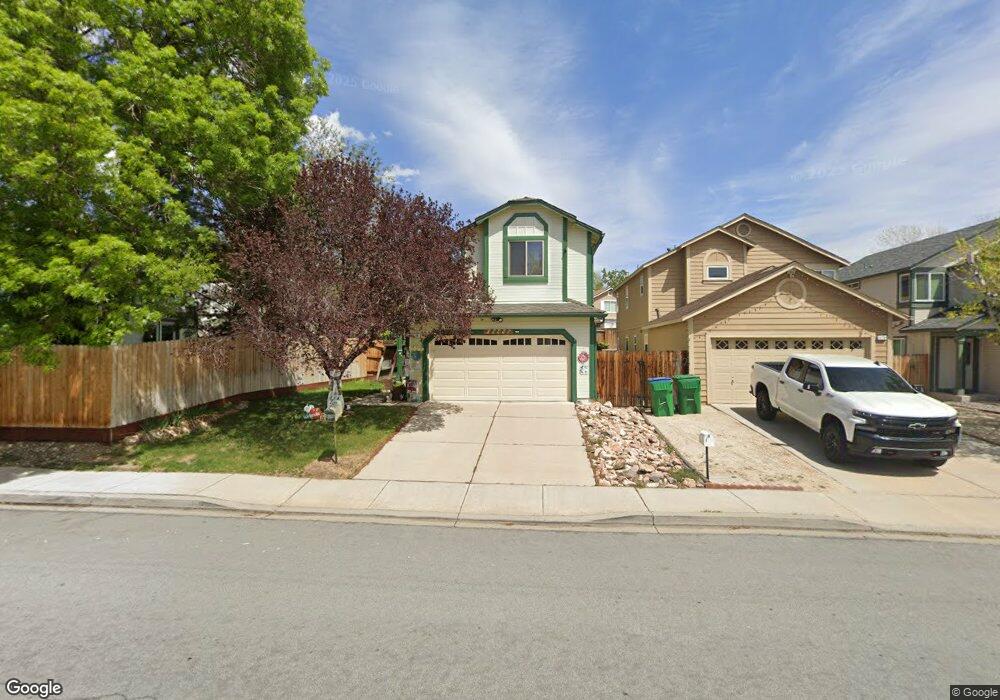
3186 Shadow Ln Sparks, NV 89434
Reed NeighborhoodEstimated Value: $430,000 - $446,000
2
Beds
3
Baths
1,490
Sq Ft
$294/Sq Ft
Est. Value
About This Home
This home is located at 3186 Shadow Ln, Sparks, NV 89434 and is currently estimated at $438,604, approximately $294 per square foot. 3186 Shadow Ln is a home located in Washoe County with nearby schools including Jerry Whitehead Elementary School, Lou Mendive Middle School, and Edward C Reed High School.
Ownership History
Date
Name
Owned For
Owner Type
Purchase Details
Closed on
Apr 23, 2000
Sold by
Deleo Alfonso C and Deleo Vicky
Bought by
Shepersky Mark A and Shepersky Shauna L
Current Estimated Value
Home Financials for this Owner
Home Financials are based on the most recent Mortgage that was taken out on this home.
Original Mortgage
$115,184
Outstanding Balance
$40,381
Interest Rate
8.99%
Estimated Equity
$398,223
Purchase Details
Closed on
Jul 7, 1994
Sold by
Mayer Marianne N
Bought by
Deleo Alfonso C and Deleo Vicky
Home Financials for this Owner
Home Financials are based on the most recent Mortgage that was taken out on this home.
Original Mortgage
$117,325
Interest Rate
8.53%
Create a Home Valuation Report for This Property
The Home Valuation Report is an in-depth analysis detailing your home's value as well as a comparison with similar homes in the area
Home Values in the Area
Average Home Value in this Area
Purchase History
| Date | Buyer | Sale Price | Title Company |
|---|---|---|---|
| Shepersky Mark A | $144,000 | Stewart Title | |
| Deleo Alfonso C | $123,500 | Stewart Title |
Source: Public Records
Mortgage History
| Date | Status | Borrower | Loan Amount |
|---|---|---|---|
| Open | Shepersky Mark A | $115,184 | |
| Previous Owner | Deleo Alfonso C | $117,325 | |
| Closed | Shepersky Mark A | $28,796 |
Source: Public Records
Tax History
| Year | Tax Paid | Tax Assessment Tax Assessment Total Assessment is a certain percentage of the fair market value that is determined by local assessors to be the total taxable value of land and additions on the property. | Land | Improvement |
|---|---|---|---|---|
| 2026 | $963 | $73,888 | $33,201 | $40,687 |
| 2024 | $1,830 | $72,267 | $29,894 | $42,373 |
| 2023 | $1,830 | $72,086 | $31,658 | $40,428 |
| 2022 | $1,777 | $57,955 | $24,066 | $33,889 |
| 2021 | $1,725 | $53,492 | $19,562 | $33,930 |
| 2020 | $1,674 | $52,838 | $18,648 | $34,190 |
| 2019 | $1,626 | $51,832 | $18,648 | $33,184 |
| 2018 | $1,575 | $45,703 | $13,010 | $32,693 |
| 2017 | $1,531 | $45,249 | $12,348 | $32,901 |
| 2016 | $1,493 | $44,822 | $11,025 | $33,797 |
| 2015 | $1,122 | $43,181 | $9,293 | $33,888 |
| 2014 | $1,448 | $40,713 | $8,127 | $32,586 |
| 2013 | -- | $38,458 | $6,174 | $32,284 |
Source: Public Records
Map
Nearby Homes
- 3142 Jarbidge Way
- 3345 Groom Way
- 1733 Golddust Dr
- 2060 Tivoli Ln Unit 2
- 2688 Laguna Way
- 2381 Tecumseh Way Unit 18
- 2415 Tecumseh Way Unit 11
- 2625 Sunny Slope Dr
- 2625 Sunny Slope Dr Unit 2
- 2600 Tuscan Way
- 2419 Tecumseh Way
- 3375 Culpepper Dr
- 2634 Michelangelo Ct
- 2407 Sunny Slope Dr Unit 1
- 2159 Meritage Dr
- 1381 Laser Ct
- 2119 Avella Dr
- 2679 Sycamore Glen Dr Unit 4
- 4301 Pinnacle Vista Ct Unit 1
- 1472 Giannotti Dr
- 3176 Shadow Ln
- 3225 Myles Dr
- 3166 Shadow Ln
- 3166 Shadow Ln Unit 1
- 3181 Myles Dr
- 3187 Myles Dr
- 3193 Myles Dr
- 3156 Shadow Ln
- 3175 Myles Dr
- 3169 Myles Dr
- 1757 Chatterly Ln
- 3185 Shadow Ln
- 3175 Shadow Ln
- 3165 Shadow Ln
- 3138 Shadow Ct
- 3163 Myles Dr
- 3136 Shadow Ct
- 3140 Shadow Ct
- 3155 Shadow Ln
- 1751 Chatterly Ln
Your Personal Tour Guide
Ask me questions while you tour the home.