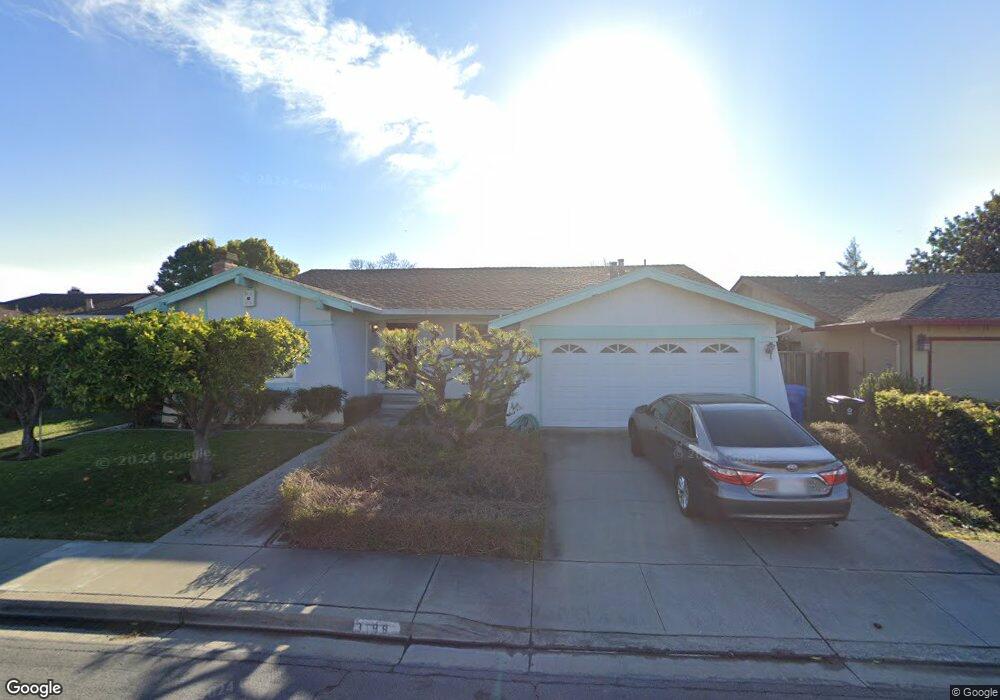
3188 Lubbock Place Fremont, CA 94536
Brookvale NeighborhoodEstimated Value: $1,605,000 - $2,091,000
4
Beds
2
Baths
1,942
Sq Ft
$975/Sq Ft
Est. Value
About This Home
This home is located at 3188 Lubbock Place, Fremont, CA 94536 and is currently estimated at $1,894,377, approximately $975 per square foot. 3188 Lubbock Place is a home located in Alameda County with nearby schools including Brookvale Elementary School, Thornton Middle School, and American High School.
Ownership History
Date
Name
Owned For
Owner Type
Purchase Details
Closed on
Jan 21, 2025
Sold by
Kania Kenneth C
Bought by
Kania Family 1997 Trust and Kania
Current Estimated Value
Purchase Details
Closed on
Mar 19, 1998
Sold by
Lahar Charlene
Bought by
Lahar Charlene M and Charlene M Lahar 1998 Inter Vi
Home Financials for this Owner
Home Financials are based on the most recent Mortgage that was taken out on this home.
Original Mortgage
$145,000
Interest Rate
6.97%
Purchase Details
Closed on
Feb 11, 1998
Sold by
Benson Craig H and Hitchcock Josephine E
Bought by
Lahar Charlene
Home Financials for this Owner
Home Financials are based on the most recent Mortgage that was taken out on this home.
Original Mortgage
$145,000
Interest Rate
6.97%
Create a Home Valuation Report for This Property
The Home Valuation Report is an in-depth analysis detailing your home's value as well as a comparison with similar homes in the area
Home Values in the Area
Average Home Value in this Area
Purchase History
| Date | Buyer | Sale Price | Title Company |
|---|---|---|---|
| Kania Family 1997 Trust | -- | None Listed On Document | |
| Charlene M Lahar 1998 Inter Vivos Trust | -- | None Listed On Document | |
| Kania Kenneth C | -- | None Listed On Document | |
| Lahar Charlene M | -- | None Listed On Document | |
| Charles L Kania And Marie I Kania 1998 Inter | -- | None Listed On Document | |
| Lahar Charlene M | -- | -- | |
| Lahar Charlene | $287,000 | First American Title Guarant |
Source: Public Records
Mortgage History
| Date | Status | Borrower | Loan Amount |
|---|---|---|---|
| Previous Owner | Lahar Charlene | $145,000 |
Source: Public Records
Tax History Compared to Growth
Tax History
| Year | Tax Paid | Tax Assessment Tax Assessment Total Assessment is a certain percentage of the fair market value that is determined by local assessors to be the total taxable value of land and additions on the property. | Land | Improvement |
|---|---|---|---|---|
| 2025 | $5,828 | $457,546 | $137,472 | $327,074 |
| 2024 | $5,828 | $448,439 | $134,777 | $320,662 |
| 2023 | $5,659 | $446,511 | $132,135 | $314,376 |
| 2022 | $5,569 | $430,758 | $129,545 | $308,213 |
| 2021 | $5,434 | $422,175 | $127,005 | $302,170 |
| 2020 | $5,401 | $424,775 | $125,703 | $299,072 |
| 2019 | $5,413 | $416,448 | $123,239 | $293,209 |
| 2018 | $5,305 | $408,284 | $120,823 | $287,461 |
| 2017 | $5,171 | $400,280 | $118,454 | $281,826 |
| 2016 | $5,075 | $392,433 | $116,132 | $276,301 |
| 2015 | $5,000 | $386,539 | $114,388 | $272,151 |
| 2014 | $4,908 | $378,968 | $112,147 | $266,821 |
Source: Public Records
Map
Nearby Homes
- 3100 Mackenzie Place
- 36992 Meadowbrook Common Unit 102
- 3371 Baywood Terrace Unit 214
- 3663 Oakwood Terrace Unit 211
- 3530 Oakwood Terrace Unit 102
- 3402 Pinewood Terrace Unit 211
- 35383 Purcell Place
- 3416 Deerwood Terrace Unit 113
- 35624 Mccarty Common
- 3443 Pepperwood Terrace Unit 301
- 3507 Buttonwood Terrace Unit 203
- 34926 Moina Shaiq Common
- 4412 Elaiso Common
- 35282 Cano Ct
- 37502 Zephyr Terrace
- 4543 Bartolo Terrace
- 2224 Peacock Place Unit 3
- 37001 Contra Costa Ave
- 34917 Sea Cliff Terrace
- 36922 Bolina Terrace
- 3206 Lubbock Place
- 3166 Lubbock Place
- 3187 Mackenzie Place
- 3179 Mackenzie Place
- 3154 Lubbock Place
- 3220 Lubbock Place
- 3207 Mackenzie Place
- 3155 Mackenzie Place
- 3175 Lubbock Place
- 3163 Lubbock Place
- 3205 Lubbock Place
- 3229 Mackenzie Place
- 3142 Lubbock Place
- 3151 Lubbock Place
- 3232 Lubbock Place Unit 6
- 3143 Mackenzie Place
- 3219 Lubbock Place
- 3139 Lubbock Place
- 3241 Mackenzie Place
- 3121 Mackenzie Place