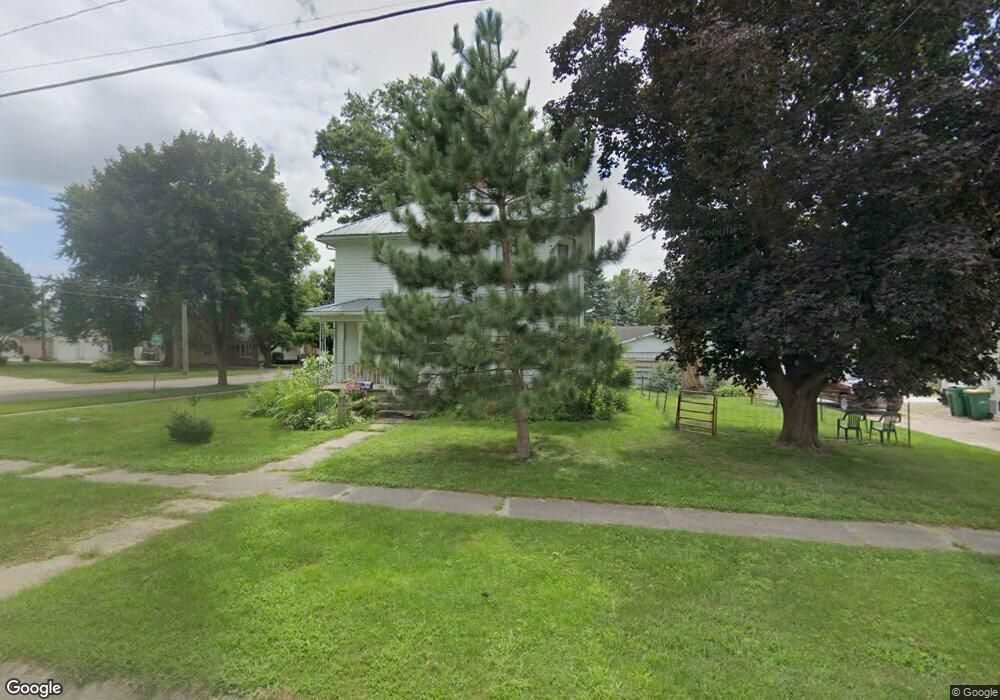
319 4th St SE Independence, IA 50644
Estimated Value: $161,000 - $245,000
4
Beds
4
Baths
2,134
Sq Ft
$90/Sq Ft
Est. Value
About This Home
This home is located at 319 4th St SE, Independence, IA 50644 and is currently estimated at $191,942, approximately $89 per square foot. 319 4th St SE is a home located in Buchanan County with nearby schools including West Elementary School, East Elementary School, and Independence Junior/Senior High School.
Ownership History
Date
Name
Owned For
Owner Type
Purchase Details
Closed on
Mar 10, 2006
Sold by
Leonard Timothy G
Bought by
Corbin Kevin L and Corbin Tammy
Current Estimated Value
Home Financials for this Owner
Home Financials are based on the most recent Mortgage that was taken out on this home.
Original Mortgage
$17,320
Interest Rate
6.33%
Mortgage Type
Stand Alone Second
Create a Home Valuation Report for This Property
The Home Valuation Report is an in-depth analysis detailing your home's value as well as a comparison with similar homes in the area
Home Values in the Area
Average Home Value in this Area
Purchase History
| Date | Buyer | Sale Price | Title Company |
|---|---|---|---|
| Corbin Kevin L | $86,000 | None Available |
Source: Public Records
Mortgage History
| Date | Status | Borrower | Loan Amount |
|---|---|---|---|
| Closed | Corbin Kevin L | $17,320 | |
| Open | Corbin Kevin L | $69,280 |
Source: Public Records
Tax History Compared to Growth
Tax History
| Year | Tax Paid | Tax Assessment Tax Assessment Total Assessment is a certain percentage of the fair market value that is determined by local assessors to be the total taxable value of land and additions on the property. | Land | Improvement |
|---|---|---|---|---|
| 2025 | $2,800 | $172,450 | $28,960 | $143,490 |
| 2024 | $2,800 | $149,990 | $25,850 | $124,140 |
| 2023 | $2,712 | $149,990 | $25,850 | $124,140 |
| 2022 | $2,392 | $122,580 | $20,520 | $102,060 |
| 2021 | $2,372 | $122,580 | $20,520 | $102,060 |
| 2020 | $2,372 | $112,940 | $18,810 | $94,130 |
| 2019 | $2,326 | $112,940 | $18,810 | $94,130 |
| 2018 | $2,355 | $109,520 | $18,810 | $90,710 |
| 2017 | $2,132 | $109,520 | $18,810 | $90,710 |
| 2016 | $2,096 | $103,810 | $10,180 | $93,630 |
| 2015 | $2,096 | $103,810 | $10,180 | $93,630 |
| 2014 | $2,138 | $103,810 | $10,180 | $93,630 |
Source: Public Records
Map
Nearby Homes