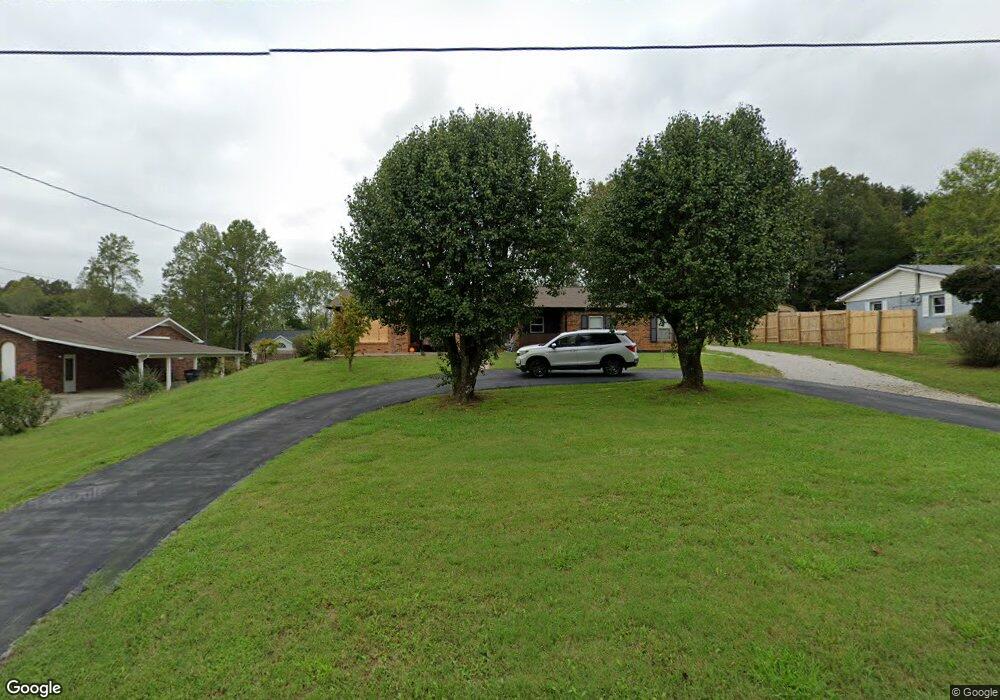
319 Cora Rd Cookeville, TN 38501
Estimated Value: $289,837 - $302,000
3
Beds
2
Baths
1,884
Sq Ft
$156/Sq Ft
Est. Value
About This Home
This home is located at 319 Cora Rd, Cookeville, TN 38501 and is currently estimated at $293,209, approximately $155 per square foot. 319 Cora Rd is a home located in Putnam County with nearby schools including Sycamore Elementary School, Cookeville High School, and Avery Trace Middle School.
Ownership History
Date
Name
Owned For
Owner Type
Purchase Details
Closed on
May 28, 2002
Sold by
Michael Smith
Bought by
Michael Smith and Michael Ella Jo
Current Estimated Value
Home Financials for this Owner
Home Financials are based on the most recent Mortgage that was taken out on this home.
Original Mortgage
$73,032
Interest Rate
6.92%
Purchase Details
Closed on
Jul 19, 1996
Sold by
Michael Smith
Bought by
Michael Smith
Purchase Details
Closed on
Jul 14, 1992
Bought by
Smith Michael and Smith Nathalie
Purchase Details
Closed on
Jul 18, 1990
Bought by
Charter Properties
Purchase Details
Closed on
Dec 4, 1989
Bought by
Hamilton Richard Kevin and Hamilton Sherry A
Purchase Details
Closed on
Jul 28, 1989
Bought by
Webb Sherry
Purchase Details
Closed on
May 4, 1984
Bought by
Webb Ricky Sherry
Purchase Details
Closed on
Jan 1, 1984
Create a Home Valuation Report for This Property
The Home Valuation Report is an in-depth analysis detailing your home's value as well as a comparison with similar homes in the area
Home Values in the Area
Average Home Value in this Area
Purchase History
| Date | Buyer | Sale Price | Title Company |
|---|---|---|---|
| Michael Smith | -- | -- | |
| Michael Smith | -- | -- | |
| Smith Michael | $59,900 | -- | |
| Charter Properties | $58,900 | -- | |
| Hamilton Richard Kevin | -- | -- | |
| Webb Sherry | -- | -- | |
| Webb Ricky Sherry | -- | -- | |
| -- | $45,000 | -- |
Source: Public Records
Mortgage History
| Date | Status | Borrower | Loan Amount |
|---|---|---|---|
| Closed | Not Available | $73,032 |
Source: Public Records
Tax History Compared to Growth
Tax History
| Year | Tax Paid | Tax Assessment Tax Assessment Total Assessment is a certain percentage of the fair market value that is determined by local assessors to be the total taxable value of land and additions on the property. | Land | Improvement |
|---|---|---|---|---|
| 2024 | $1,260 | $35,200 | $4,775 | $30,425 |
| 2023 | $1,260 | $35,200 | $4,775 | $30,425 |
| 2022 | $1,159 | $35,200 | $4,775 | $30,425 |
| 2021 | $1,159 | $35,200 | $4,775 | $30,425 |
| 2020 | $953 | $35,200 | $4,775 | $30,425 |
| 2019 | $847 | $24,325 | $4,775 | $19,550 |
| 2018 | $773 | $21,650 | $4,775 | $16,875 |
| 2017 | $773 | $21,650 | $4,775 | $16,875 |
| 2016 | $773 | $21,650 | $4,775 | $16,875 |
| 2015 | $802 | $21,650 | $4,775 | $16,875 |
| 2014 | $840 | $22,676 | $0 | $0 |
Source: Public Records
Map
Nearby Homes
- 1405 Brook Hill Dr
- 1408 Oak Grove Dr
- 1212 Crescent Dr
- 1804 Benton Young Rd
- 1486 Abner Allen Rd
- 2300 Sun Valley Cir
- 443 Ellis Ave
- 553 County Farm Rd
- 2.52 ac W Broad St
- 850 Lewis St
- 0 Lewis St
- 1688 Farmington Dr
- 1376 Buckingham Place
- 1198 N Franklin Ave
- 1308 Bridle Path
- 1205 Buckingham Place
- 1957 W Broad St
- 6.39 Ac Shipley Church Rd
- 0 Shipley Church Rd
- Lot 3 Miller