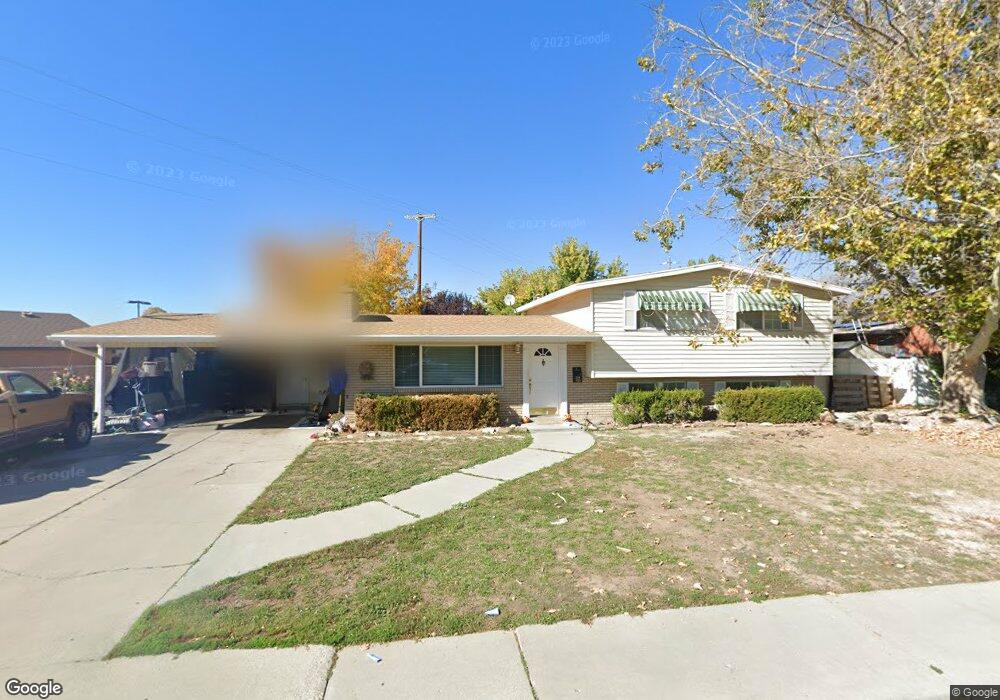
319 E 1655 S Orem, UT 84058
Cherry Hill NeighborhoodEstimated Value: $472,000 - $484,983
4
Beds
2
Baths
2,168
Sq Ft
$220/Sq Ft
Est. Value
About This Home
This home is located at 319 E 1655 S, Orem, UT 84058 and is currently estimated at $476,328, approximately $219 per square foot. 319 E 1655 S is a home located in Utah County with nearby schools including Cherry Hill Elementary School, Lakeridge Jr High School, and Mountain View High School.
Ownership History
Date
Name
Owned For
Owner Type
Purchase Details
Closed on
Jun 13, 2012
Sold by
Fairbanks Trenton and Estate Of Julie Mckenzie Fairb
Bought by
Havea Kalili
Current Estimated Value
Home Financials for this Owner
Home Financials are based on the most recent Mortgage that was taken out on this home.
Original Mortgage
$6,230
Outstanding Balance
$4,310
Interest Rate
3.79%
Mortgage Type
Stand Alone Second
Estimated Equity
$472,019
Purchase Details
Closed on
Dec 12, 2008
Sold by
Fairbanks Peter N
Bought by
Fairbanks Julie M
Purchase Details
Closed on
Oct 2, 2002
Sold by
Gutierrez Donna Lee and Donna Lee Gutierrez Trust
Bought by
Fairbanks Peter N and Fairbanks Julie M
Home Financials for this Owner
Home Financials are based on the most recent Mortgage that was taken out on this home.
Original Mortgage
$138,000
Interest Rate
5%
Create a Home Valuation Report for This Property
The Home Valuation Report is an in-depth analysis detailing your home's value as well as a comparison with similar homes in the area
Home Values in the Area
Average Home Value in this Area
Purchase History
| Date | Buyer | Sale Price | Title Company |
|---|---|---|---|
| Havea Kalili | -- | First Title Ins Ag | |
| Fairbanks Julie M | -- | None Available | |
| Fairbanks Peter N | -- | Backman Stewart Title Servi |
Source: Public Records
Mortgage History
| Date | Status | Borrower | Loan Amount |
|---|---|---|---|
| Open | Havea Kalili | $6,230 | |
| Previous Owner | Fairbanks Peter N | $138,000 |
Source: Public Records
Tax History
| Year | Tax Paid | Tax Assessment Tax Assessment Total Assessment is a certain percentage of the fair market value that is determined by local assessors to be the total taxable value of land and additions on the property. | Land | Improvement |
|---|---|---|---|---|
| 2025 | $1,910 | $233,475 | -- | -- |
| 2024 | $1,910 | $233,585 | $0 | $0 |
| 2023 | $1,772 | $232,925 | $0 | $0 |
| 2022 | $1,757 | $223,740 | $0 | $0 |
| 2021 | $1,553 | $299,400 | $134,500 | $164,900 |
| 2020 | $1,412 | $267,700 | $107,600 | $160,100 |
| 2019 | $1,256 | $247,600 | $93,300 | $154,300 |
| 2018 | $1,189 | $223,900 | $89,700 | $134,200 |
| 2017 | $1,129 | $113,905 | $0 | $0 |
| 2016 | $1,088 | $101,255 | $0 | $0 |
| 2015 | $1,059 | $93,170 | $0 | $0 |
| 2014 | $1,000 | $87,560 | $0 | $0 |
Source: Public Records
Map
Nearby Homes
Your Personal Tour Guide
Ask me questions while you tour the home.