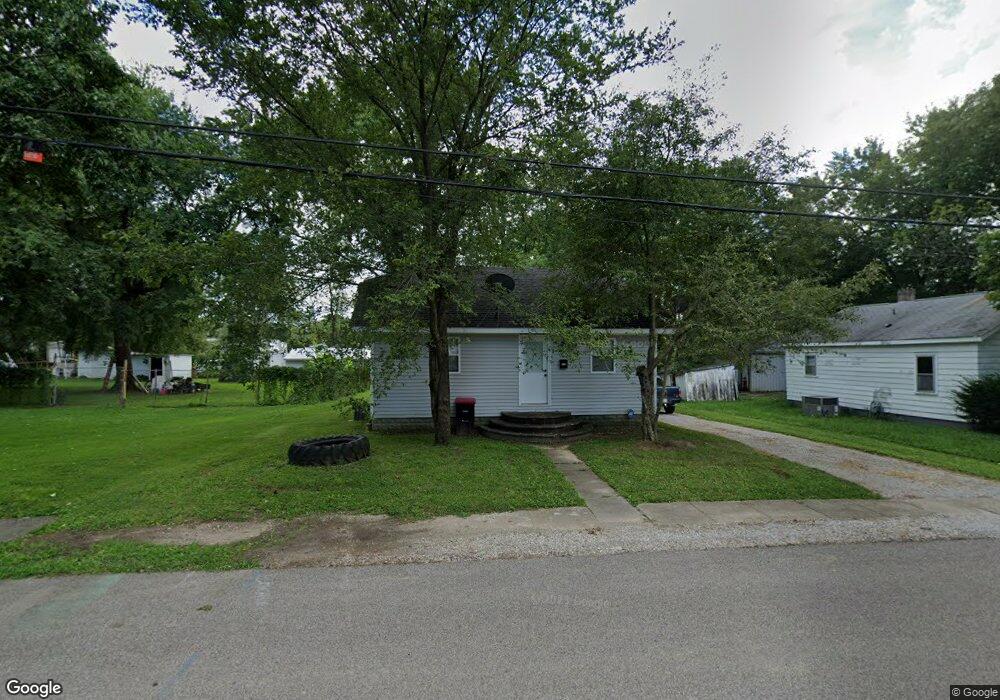
319 E Walnut St Boonville, IN 47601
Estimated Value: $82,000 - $128,000
--
Bed
1
Bath
864
Sq Ft
$122/Sq Ft
Est. Value
About This Home
This home is located at 319 E Walnut St, Boonville, IN 47601 and is currently estimated at $105,333, approximately $121 per square foot. 319 E Walnut St is a home located in Warrick County with nearby schools including Oakdale Elementary School, Boonville Middle School, and Boonville High School.
Ownership History
Date
Name
Owned For
Owner Type
Purchase Details
Closed on
Sep 28, 2011
Sold by
The Lynnville National Bank
Bought by
Taber Services Llc
Current Estimated Value
Home Financials for this Owner
Home Financials are based on the most recent Mortgage that was taken out on this home.
Original Mortgage
$597,526
Outstanding Balance
$409,887
Interest Rate
4.22%
Mortgage Type
Future Advance Clause Open End Mortgage
Estimated Equity
-$304,554
Purchase Details
Closed on
Jun 30, 2011
Sold by
Wissel Stacy M and Bankruptcy Estate Of John M Gr
Bought by
Lynnville National Bank
Create a Home Valuation Report for This Property
The Home Valuation Report is an in-depth analysis detailing your home's value as well as a comparison with similar homes in the area
Home Values in the Area
Average Home Value in this Area
Purchase History
| Date | Buyer | Sale Price | Title Company |
|---|---|---|---|
| Taber Services Llc | -- | None Available | |
| Lynnville National Bank | -- | None Available |
Source: Public Records
Mortgage History
| Date | Status | Borrower | Loan Amount |
|---|---|---|---|
| Open | Taber Services Llc | $597,526 |
Source: Public Records
Tax History Compared to Growth
Tax History
| Year | Tax Paid | Tax Assessment Tax Assessment Total Assessment is a certain percentage of the fair market value that is determined by local assessors to be the total taxable value of land and additions on the property. | Land | Improvement |
|---|---|---|---|---|
| 2024 | $1,738 | $86,900 | $11,200 | $75,700 |
| 2023 | $1,648 | $82,400 | $6,700 | $75,700 |
| 2022 | $730 | $36,500 | $8,400 | $28,100 |
| 2021 | $584 | $29,200 | $6,700 | $22,500 |
| 2020 | $570 | $25,500 | $6,700 | $18,800 |
| 2019 | $536 | $23,800 | $6,700 | $17,100 |
| 2018 | $452 | $22,600 | $6,700 | $15,900 |
| 2017 | $440 | $22,000 | $6,700 | $15,300 |
| 2016 | $434 | $21,700 | $6,700 | $15,000 |
| 2014 | $456 | $22,800 | $7,800 | $15,000 |
| 2013 | $460 | $23,000 | $7,800 | $15,200 |
Source: Public Records
Map
Nearby Homes