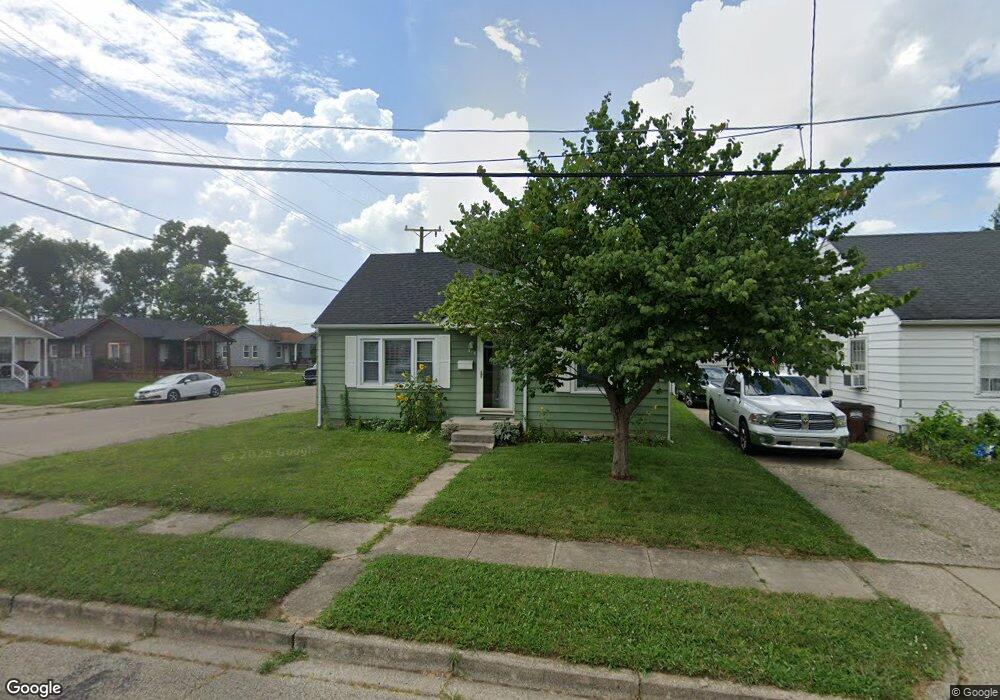
319 Elm St Franklin, OH 45005
Estimated Value: $149,940 - $175,000
2
Beds
1
Bath
1,069
Sq Ft
$152/Sq Ft
Est. Value
About This Home
This home is located at 319 Elm St, Franklin, OH 45005 and is currently estimated at $162,485, approximately $151 per square foot. 319 Elm St is a home located in Warren County with nearby schools including Franklin High School and The CinDay Academy.
Ownership History
Date
Name
Owned For
Owner Type
Purchase Details
Closed on
Nov 3, 2003
Sold by
Jones Danny R and Jones Judy L
Bought by
Roach William H
Current Estimated Value
Home Financials for this Owner
Home Financials are based on the most recent Mortgage that was taken out on this home.
Original Mortgage
$81,090
Outstanding Balance
$37,646
Interest Rate
6.02%
Mortgage Type
VA
Estimated Equity
$124,839
Purchase Details
Closed on
Mar 6, 1998
Sold by
Young Paul
Bought by
Jones Danny R and Jones Judy L
Home Financials for this Owner
Home Financials are based on the most recent Mortgage that was taken out on this home.
Original Mortgage
$74,064
Interest Rate
7.08%
Mortgage Type
FHA
Purchase Details
Closed on
Jul 3, 1984
Sold by
French Julius C and French Julius C
Bought by
Young and Young Paul L
Purchase Details
Closed on
Mar 3, 1982
Sold by
French French and French Gladys L
Create a Home Valuation Report for This Property
The Home Valuation Report is an in-depth analysis detailing your home's value as well as a comparison with similar homes in the area
Home Values in the Area
Average Home Value in this Area
Purchase History
| Date | Buyer | Sale Price | Title Company |
|---|---|---|---|
| Roach William H | $79,500 | Diamond Title Agency Inc | |
| Jones Danny R | $74,900 | -- | |
| Young | $38,000 | -- | |
| -- | -- | -- |
Source: Public Records
Mortgage History
| Date | Status | Borrower | Loan Amount |
|---|---|---|---|
| Open | Roach William H | $81,090 | |
| Previous Owner | Jones Danny R | $74,064 |
Source: Public Records
Tax History Compared to Growth
Tax History
| Year | Tax Paid | Tax Assessment Tax Assessment Total Assessment is a certain percentage of the fair market value that is determined by local assessors to be the total taxable value of land and additions on the property. | Land | Improvement |
|---|---|---|---|---|
| 2024 | $2,324 | $43,690 | $5,930 | $37,760 |
| 2023 | $1,944 | $34,496 | $3,923 | $30,572 |
| 2022 | $1,909 | $34,496 | $3,924 | $30,573 |
| 2021 | $1,817 | $34,496 | $3,924 | $30,573 |
| 2020 | $1,661 | $27,598 | $3,140 | $24,458 |
| 2019 | $1,523 | $27,598 | $3,140 | $24,458 |
| 2018 | $1,369 | $27,598 | $3,140 | $24,458 |
| 2017 | $1,618 | $26,926 | $3,115 | $23,811 |
| 2016 | $1,646 | $26,926 | $3,115 | $23,811 |
| 2015 | $1,647 | $26,926 | $3,115 | $23,811 |
| 2014 | $1,531 | $26,930 | $3,120 | $23,810 |
| 2013 | $1,314 | $30,150 | $3,490 | $26,660 |
Source: Public Records
Map
Nearby Homes
- 1504 Knightsbridge Ct
- 0 E 4th St
- 521 S Main St
- 627 S River St
- 105 Chestnut St Unit 1
- 631 S River St
- 605 Spring Ave
- 233 S Main St
- 235 S Main St
- 519 Anderson St
- 213 Locust St
- 1200 Riley Blvd
- 820 S River St
- 121 E 5th St
- 315 Bridge St
- 7 Highland St
- 0 Victoria Dr Unit 1852824
- 0 Victoria Dr Unit 942075
- 1010 S Main St
- 102 Warren Ave