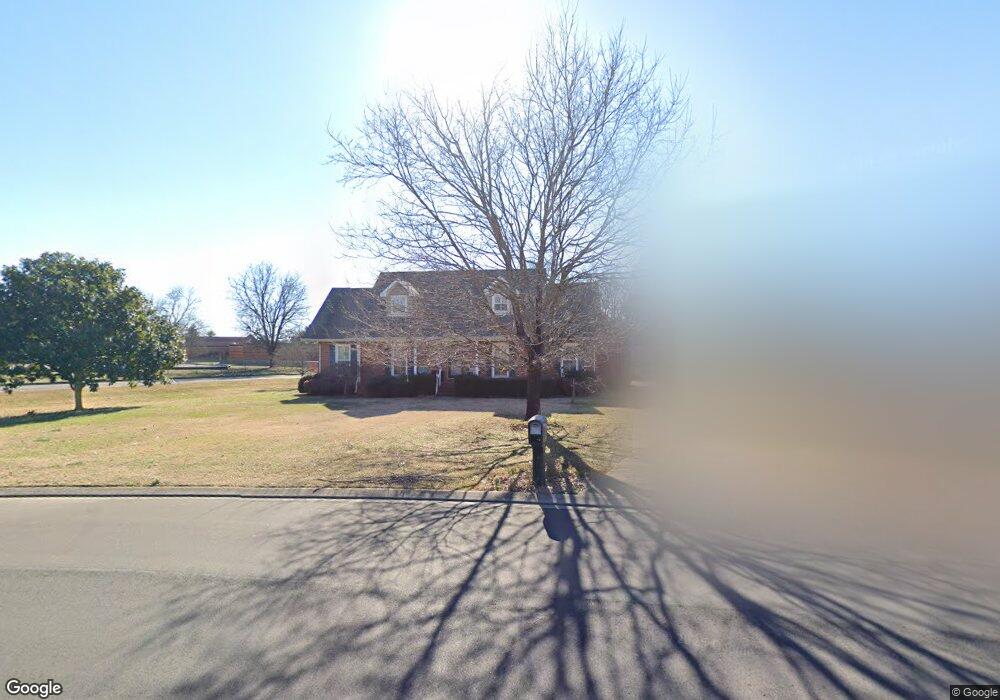
319 Haynes Haven Ln Murfreesboro, TN 37129
Estimated Value: $476,039 - $560,000
--
Bed
3
Baths
2,401
Sq Ft
$217/Sq Ft
Est. Value
About This Home
This home is located at 319 Haynes Haven Ln, Murfreesboro, TN 37129 and is currently estimated at $521,510, approximately $217 per square foot. 319 Haynes Haven Ln is a home located in Rutherford County with nearby schools including Northfield Elementary School, Siegel Middle School, and Siegel High School.
Ownership History
Date
Name
Owned For
Owner Type
Purchase Details
Closed on
Mar 4, 2004
Sold by
Wilson Donald L and Wilson Mary J
Bought by
Towe Kevin L and Towe Theresa T
Current Estimated Value
Home Financials for this Owner
Home Financials are based on the most recent Mortgage that was taken out on this home.
Original Mortgage
$183,250
Interest Rate
5.68%
Purchase Details
Closed on
Nov 4, 2002
Sold by
Dupuis Wayne R and Dupuis Ellen
Bought by
Alley Properties Inc
Purchase Details
Closed on
May 22, 2000
Sold by
Wilson Donald L
Bought by
Dupuis Wayne R and Dupuis Ellen
Purchase Details
Closed on
Sep 22, 1999
Sold by
Lockwood Joseph C
Bought by
Wilson Donald L and Wilson Mary J
Home Financials for this Owner
Home Financials are based on the most recent Mortgage that was taken out on this home.
Original Mortgage
$126,800
Interest Rate
8.35%
Purchase Details
Closed on
Jun 11, 1996
Sold by
Adams Douglas W
Bought by
Lockwood and Joyce
Create a Home Valuation Report for This Property
The Home Valuation Report is an in-depth analysis detailing your home's value as well as a comparison with similar homes in the area
Home Values in the Area
Average Home Value in this Area
Purchase History
| Date | Buyer | Sale Price | Title Company |
|---|---|---|---|
| Towe Kevin L | $192,900 | -- | |
| Alley Properties Inc | $155,000 | -- | |
| Dupuis Wayne R | $144,900 | -- | |
| Wilson Donald L | $158,500 | -- | |
| Lockwood | $144,500 | -- |
Source: Public Records
Mortgage History
| Date | Status | Borrower | Loan Amount |
|---|---|---|---|
| Closed | Lockwood | $183,250 | |
| Previous Owner | Lockwood | $126,800 |
Source: Public Records
Tax History Compared to Growth
Tax History
| Year | Tax Paid | Tax Assessment Tax Assessment Total Assessment is a certain percentage of the fair market value that is determined by local assessors to be the total taxable value of land and additions on the property. | Land | Improvement |
|---|---|---|---|---|
| 2025 | $2,939 | $103,875 | $15,000 | $88,875 |
| 2024 | $2,939 | $103,875 | $15,000 | $88,875 |
| 2023 | $1,949 | $103,875 | $15,000 | $88,875 |
| 2022 | $1,679 | $103,875 | $15,000 | $88,875 |
| 2021 | $1,641 | $73,950 | $13,125 | $60,825 |
| 2020 | $1,641 | $73,950 | $13,125 | $60,825 |
| 2019 | $1,641 | $73,950 | $13,125 | $60,825 |
| 2018 | $2,255 | $73,950 | $0 | $0 |
| 2017 | $2,293 | $59,000 | $0 | $0 |
| 2016 | $2,293 | $59,000 | $0 | $0 |
| 2015 | $2,293 | $59,000 | $0 | $0 |
| 2014 | $1,467 | $59,000 | $0 | $0 |
| 2013 | -- | $53,800 | $0 | $0 |
Source: Public Records
Map
Nearby Homes
- 323 Haynes Haven Ln
- 403 Clubridge Ct
- 402 Clubridge Ct
- 314 Haynes Haven Ln
- 327 Haynes Haven Ln
- 310 Haynes Haven Ln
- 407 Clubridge Ct
- 307 Haynes Haven Ln
- 307 Haynes Haven Ln Unit Hr
- 403 Peacock Ave
- 406 Clubridge Ct
- 319 Peacock Ave
- 407 Peacock Ave
- 315 Peacock Ave
- 306 Haynes Haven Ln
- 411 Peacock Ave
- 303 Haynes Haven Ln
- 411 Clubridge Ct
- 410 Clubridge Ct
- 311 Peacock Ave