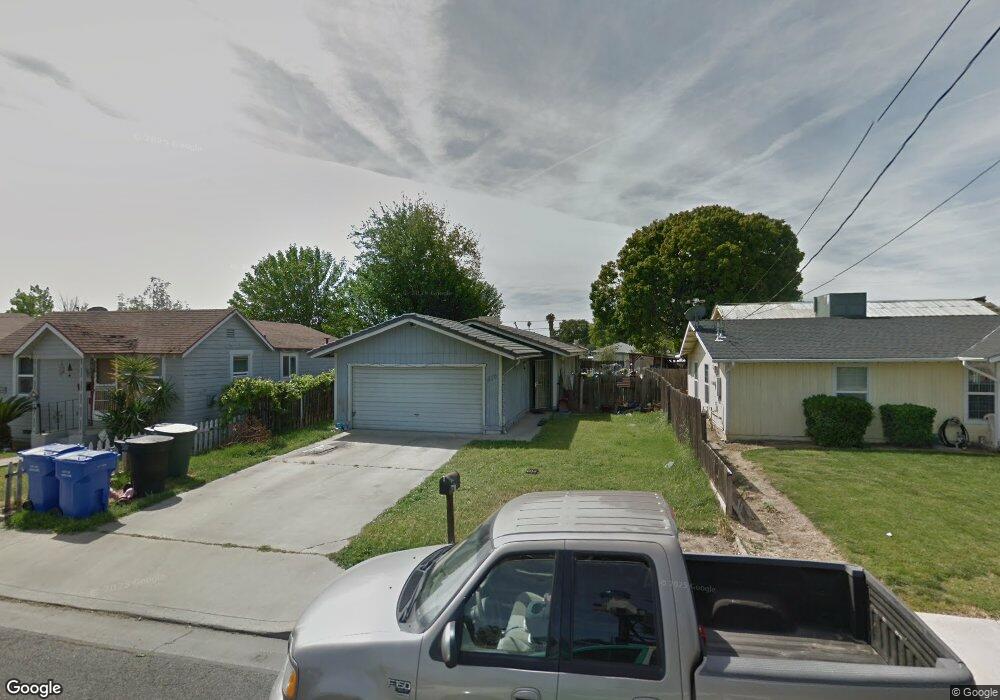
319 Magnolia Ave Lemoore, CA 93245
Estimated Value: $294,000 - $313,000
3
Beds
2
Baths
1,272
Sq Ft
$235/Sq Ft
Est. Value
About This Home
This home is located at 319 Magnolia Ave, Lemoore, CA 93245 and is currently estimated at $299,427, approximately $235 per square foot. 319 Magnolia Ave is a home located in Kings County with nearby schools including Lemoore Elementary School, Liberty Middle School, and Lemoore High School.
Ownership History
Date
Name
Owned For
Owner Type
Purchase Details
Closed on
Jan 6, 1999
Sold by
Ocwen Federal Bank Fsb
Bought by
Sumaya Rosemarie D
Current Estimated Value
Home Financials for this Owner
Home Financials are based on the most recent Mortgage that was taken out on this home.
Original Mortgage
$66,398
Interest Rate
6.78%
Mortgage Type
FHA
Purchase Details
Closed on
Jul 27, 1998
Sold by
Soto Thomas and Soto Maria C
Bought by
Ocwen Federal Bank Fsb
Create a Home Valuation Report for This Property
The Home Valuation Report is an in-depth analysis detailing your home's value as well as a comparison with similar homes in the area
Home Values in the Area
Average Home Value in this Area
Purchase History
| Date | Buyer | Sale Price | Title Company |
|---|---|---|---|
| Sumaya Rosemarie D | $66,500 | Chicago Title Co | |
| Ocwen Federal Bank Fsb | $61,082 | Chicago Title Co |
Source: Public Records
Mortgage History
| Date | Status | Borrower | Loan Amount |
|---|---|---|---|
| Previous Owner | Sumaya Rosemarie D | $66,398 |
Source: Public Records
Tax History Compared to Growth
Tax History
| Year | Tax Paid | Tax Assessment Tax Assessment Total Assessment is a certain percentage of the fair market value that is determined by local assessors to be the total taxable value of land and additions on the property. | Land | Improvement |
|---|---|---|---|---|
| 2025 | $985 | $104,253 | $39,191 | $65,062 |
| 2023 | $985 | $100,207 | $37,670 | $62,537 |
| 2022 | $1,031 | $98,243 | $36,932 | $61,311 |
| 2021 | $1,003 | $96,317 | $36,208 | $60,109 |
| 2020 | $997 | $95,330 | $35,837 | $59,493 |
| 2019 | $988 | $93,460 | $35,134 | $58,326 |
| 2018 | $926 | $91,627 | $34,445 | $57,182 |
| 2017 | $927 | $89,831 | $33,770 | $56,061 |
| 2016 | $871 | $88,070 | $33,108 | $54,962 |
| 2015 | $866 | $86,747 | $32,611 | $54,136 |
| 2014 | $839 | $85,048 | $31,972 | $53,076 |
Source: Public Records
Map
Nearby Homes