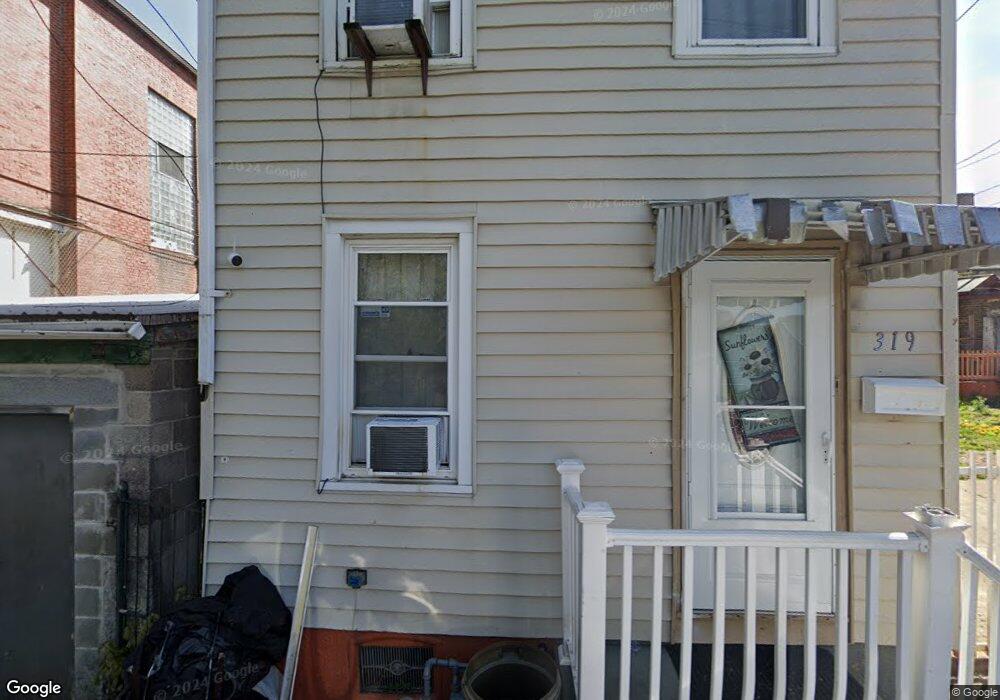
319 N Bryan St Allentown, PA 18102
1st Ward NeighborhoodEstimated Value: $102,000 - $176,000
3
Beds
1
Bath
1,424
Sq Ft
$107/Sq Ft
Est. Value
About This Home
This home is located at 319 N Bryan St, Allentown, PA 18102 and is currently estimated at $152,490, approximately $107 per square foot. 319 N Bryan St is a home located in Lehigh County with nearby schools including Sheridan Elementary School, Harrison-Morton Middle School, and Louis E. Dieruff High School.
Ownership History
Date
Name
Owned For
Owner Type
Purchase Details
Closed on
May 25, 2006
Sold by
Ruiz Raul and Cruz Genoveva
Bought by
Quinones Rene
Current Estimated Value
Home Financials for this Owner
Home Financials are based on the most recent Mortgage that was taken out on this home.
Original Mortgage
$98,021
Outstanding Balance
$57,255
Interest Rate
6.55%
Mortgage Type
FHA
Estimated Equity
$95,235
Purchase Details
Closed on
Jun 20, 1989
Bought by
Ruiz Raul and Genoveva Cruz
Purchase Details
Closed on
Mar 17, 1989
Sold by
Kruk Emilia
Bought by
Detweiler Todd L
Purchase Details
Closed on
Apr 26, 1977
Bought by
Kruk Emilia
Create a Home Valuation Report for This Property
The Home Valuation Report is an in-depth analysis detailing your home's value as well as a comparison with similar homes in the area
Home Values in the Area
Average Home Value in this Area
Purchase History
| Date | Buyer | Sale Price | Title Company |
|---|---|---|---|
| Quinones Rene | $99,000 | None Available | |
| Ruiz Raul | $49,000 | -- | |
| Detweiler Todd L | $33,000 | -- | |
| Kruk Emilia | $6,900 | -- |
Source: Public Records
Mortgage History
| Date | Status | Borrower | Loan Amount |
|---|---|---|---|
| Open | Quinones Rene | $98,021 |
Source: Public Records
Tax History Compared to Growth
Tax History
| Year | Tax Paid | Tax Assessment Tax Assessment Total Assessment is a certain percentage of the fair market value that is determined by local assessors to be the total taxable value of land and additions on the property. | Land | Improvement |
|---|---|---|---|---|
| 2025 | $1,842 | $56,200 | $5,600 | $50,600 |
| 2024 | $1,842 | $56,200 | $5,600 | $50,600 |
| 2023 | $1,842 | $56,200 | $5,600 | $50,600 |
| 2022 | $1,778 | $56,200 | $50,600 | $5,600 |
| 2021 | $1,743 | $56,200 | $5,600 | $50,600 |
| 2020 | $1,698 | $56,200 | $5,600 | $50,600 |
| 2019 | $1,670 | $56,200 | $5,600 | $50,600 |
| 2018 | $1,557 | $56,200 | $5,600 | $50,600 |
| 2017 | $1,518 | $56,200 | $5,600 | $50,600 |
| 2016 | -- | $56,200 | $5,600 | $50,600 |
| 2015 | -- | $56,200 | $5,600 | $50,600 |
| 2014 | -- | $56,200 | $5,600 | $50,600 |
Source: Public Records
Map
Nearby Homes