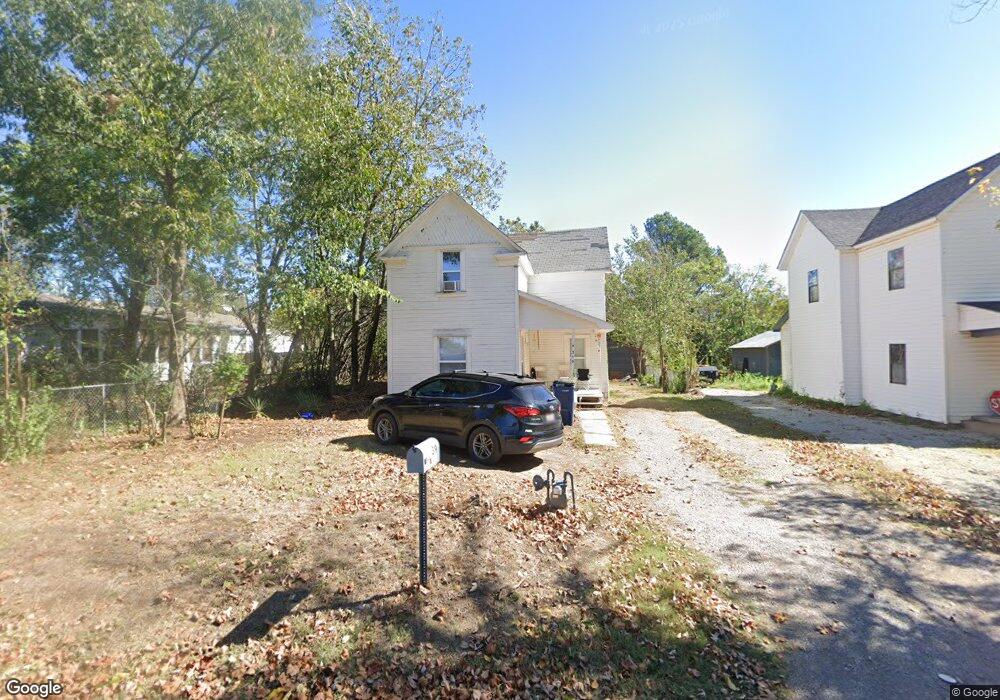
319 N Kimberly Ave Shawnee, OK 74801
Estimated Value: $87,000 - $131,000
4
Beds
1
Bath
1,408
Sq Ft
$81/Sq Ft
Est. Value
About This Home
This home is located at 319 N Kimberly Ave, Shawnee, OK 74801 and is currently estimated at $114,161, approximately $81 per square foot. 319 N Kimberly Ave is a home located in Pottawatomie County with nearby schools including Horace Mann Elementary School, Shawnee Middle School, and Shawnee High School.
Ownership History
Date
Name
Owned For
Owner Type
Purchase Details
Closed on
Sep 30, 2016
Sold by
Arvest Bank
Bought by
Acock Properties Llc
Current Estimated Value
Home Financials for this Owner
Home Financials are based on the most recent Mortgage that was taken out on this home.
Original Mortgage
$12,750
Interest Rate
3.43%
Mortgage Type
Seller Take Back
Purchase Details
Closed on
Apr 18, 2016
Sold by
Curry Stan and Curry Kim
Bought by
Arvest Bank
Purchase Details
Closed on
Aug 30, 2002
Sold by
Robinson Lisa and Robinson James
Bought by
Curry Stan and Curry Kim
Purchase Details
Closed on
Feb 13, 2002
Sold by
Kneisel Johnny and Kneisel Shirley
Bought by
Robinson Lisa and Robinson James
Purchase Details
Closed on
Dec 11, 1998
Sold by
Hopkins James and Hopkins Karen
Bought by
Kneisel Johnny and Kneisel Shirley
Purchase Details
Closed on
Jan 10, 1996
Sold by
Knight Juanita
Bought by
Hopkins James and Hopkins Karen
Create a Home Valuation Report for This Property
The Home Valuation Report is an in-depth analysis detailing your home's value as well as a comparison with similar homes in the area
Home Values in the Area
Average Home Value in this Area
Purchase History
| Date | Buyer | Sale Price | Title Company |
|---|---|---|---|
| Acock Properties Llc | $15,000 | First American Title | |
| Arvest Bank | $19,376 | None Available | |
| Curry Stan | $29,000 | -- | |
| Robinson Lisa | $16,000 | -- | |
| Kneisel Johnny | $10,000 | -- | |
| Hopkins James | -- | -- |
Source: Public Records
Mortgage History
| Date | Status | Borrower | Loan Amount |
|---|---|---|---|
| Closed | Acock Properties Llc | $12,750 |
Source: Public Records
Tax History Compared to Growth
Tax History
| Year | Tax Paid | Tax Assessment Tax Assessment Total Assessment is a certain percentage of the fair market value that is determined by local assessors to be the total taxable value of land and additions on the property. | Land | Improvement |
|---|---|---|---|---|
| 2024 | $381 | $3,825 | $505 | $3,320 |
| 2023 | $381 | $3,643 | $840 | $2,803 |
| 2022 | $374 | $3,643 | $840 | $2,803 |
| 2021 | $367 | $3,643 | $840 | $2,803 |
| 2020 | $368 | $3,643 | $840 | $2,803 |
| 2019 | $380 | $3,643 | $840 | $2,803 |
| 2018 | $366 | $3,572 | $840 | $2,732 |
| 2017 | $358 | $3,551 | $840 | $2,711 |
| 2016 | $377 | $3,697 | $641 | $3,056 |
| 2015 | $352 | $3,521 | $598 | $2,923 |
| 2014 | $335 | $3,353 | $557 | $2,796 |
Source: Public Records
Map
Nearby Homes
- 210 N Roosevelt Ave
- 1330 E Whittaker St
- 1328 E 10th St
- 1326 E 10th St
- 124 N Pesotum Ave
- 703 N Roosevelt Ave
- 1330 E Main St
- 322 N Draper Ave
- 648 N Cleveland Ave
- 711 N Cleveland Ave
- 1322 E Margaret St
- 1320 E Margaret St
- 1314 E Margaret St
- 1235 E Edwards St
- 1119 E 11th St
- 0 E Fay St
- 1214 E Edwards St
- 1127 E 10th St
- 1824 E Remington St
- 301 Clubhouse Dr
- 1701 E 11th St
- 317 N Kimberly Ave
- 327 N Roosevelt Ave
- 315 N Kimberly Ave
- 328 N Roosevelt Ave
- 309 N Roosevelt Ave
- 1702 E 11th St
- 318 N Kimberly Ave
- 320 N Kimberly Ave
- 308 N Roosevelt Ave
- 402 N Roosevelt Ave
- 404 N Kimberly Ave
- 406 N Kimberly Ave
- 402 N Kimberly Ave
- 1702 E 10th St
- 305 N Kimberly Ave
- 316 N Roosevelt Ave
- 413 N Kimberly Ave
- 418 N Roosevelt Ave
- 408 N Roosevelt Ave