
Seller's Agent in 2025
Michael Harman
Harman Realty
(563) 380-9136
53 in this area
87 Total Sales
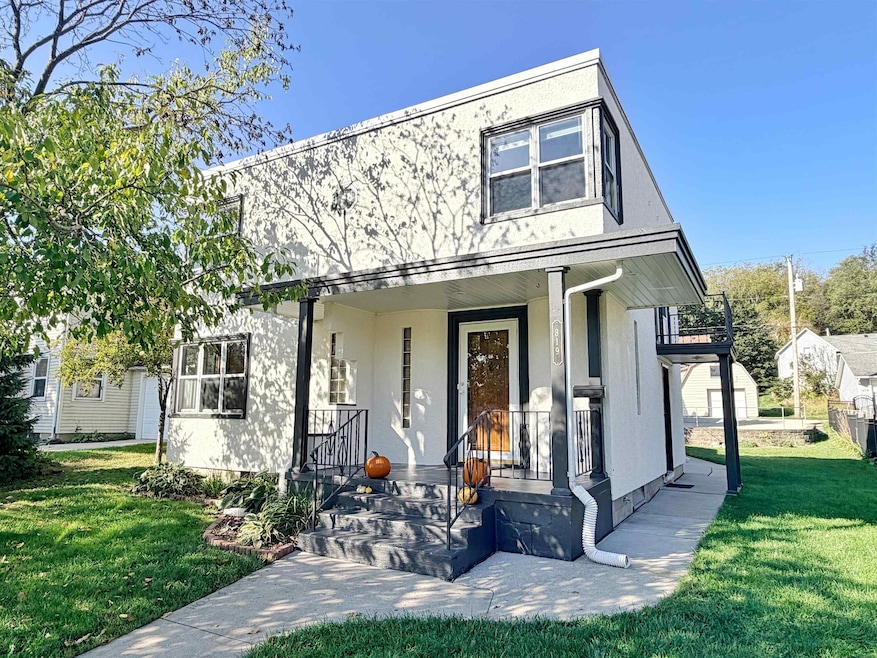


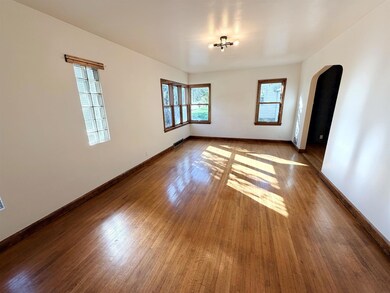


Welcome to 319 Pershing Avenue in Decorah, a charming home blending classic character with thoughtful updates in a desirable, walkable location. Step inside to find a beautifully updated kitchen featuring custom Gossling cabinetry, granite countertops, hardwood floors, and included appliances, opening to both a large formal living room and a cozy family room addition with a gas fireplace and patio doors leading to the back patio. A convenient half bathroom completes the main level, while upstairs you’ll find three bright and spacious bedrooms and a full bathroom. The lower level offers additional living space with a recreational room, perfect for hobbies or relaxing. Outside, enjoy the landscaped yard, a detached one-stall garage, and a quiet street setting, all just a few minutes walk from the Trout Run Trail, parks, schools, and downtown Decorah.
| Date | Type | Sale Price | Title Company |
|---|---|---|---|
| Warranty Deed | $279,500 | None Listed On Document | |
| Warranty Deed | $230,000 | -- | |
| Warranty Deed | $174,500 | None Available |
| Date | Status | Loan Amount | Loan Type |
|---|---|---|---|
| Previous Owner | $184,000 | No Value Available | |
| Previous Owner | $139,600 | FHA |
| Date | Event | Price | List to Sale | Price per Sq Ft |
|---|---|---|---|---|
| 11/10/2025 11/10/25 | Sold | $279,500 | -3.3% | $138 / Sq Ft |
| 10/08/2025 10/08/25 | Pending | -- | -- | -- |
| 09/29/2025 09/29/25 | For Sale | $289,000 | -- | $142 / Sq Ft |
| Year | Tax Paid | Tax Assessment Tax Assessment Total Assessment is a certain percentage of the fair market value that is determined by local assessors to be the total taxable value of land and additions on the property. | Land | Improvement |
|---|---|---|---|---|
| 2025 | $4,450 | $268,010 | $24,000 | $244,010 |
| 2024 | $4,450 | $236,420 | $24,000 | $212,420 |
| 2023 | $4,068 | $236,420 | $24,000 | $212,420 |
| 2022 | $3,626 | $204,110 | $20,000 | $184,110 |
| 2021 | $3,424 | $188,610 | $20,000 | $168,610 |
| 2020 | $3,424 | $175,080 | $20,000 | $155,080 |
| 2019 | $3,332 | $175,080 | $0 | $0 |
| 2018 | $3,352 | $175,080 | $0 | $0 |
| 2017 | $3,552 | $177,850 | $0 | $0 |
| 2016 | $3,494 | $177,850 | $0 | $0 |
| 2015 | $3,316 | $169,260 | $0 | $0 |
| 2014 | $3,250 | $169,260 | $0 | $0 |
Seller's Agent in 2025
Michael Harman
Harman Realty
(563) 380-9136
53 in this area
87 Total Sales
Buyer's Agent in 2025
Sarah Zbornik
AJ Realty, Inc.
(563) 379-1292
75 in this area
84 Total Sales
Source: Northeast Iowa Regional Board of REALTORS®
MLS Number: NBR20254780
APN: 111537601000
Disclaimer: Certain information contained herein is derived from information provided by parties other than Homes.com. All information provided is deemed reliable, but is not guaranteed to be accurate and should be independently verified.
![]() Based on information submitted to the MLS GRID. All data is obtained from various sources and may not have been verified by broker or MLS GRID. Supplied Open House Information is subject to change without notice. All information should be independently reviewed and verified for accuracy. Properties may or may not be listed by the office/agent presenting the information. Some IDX listings have been excluded from this website. IDX information is provided exclusively for personal, non-commercial use, and may not be used for any purpose other than to identify prospective properties consumers may be interested in purchasing. Information is deemed reliable but not guaranteed.
Based on information submitted to the MLS GRID. All data is obtained from various sources and may not have been verified by broker or MLS GRID. Supplied Open House Information is subject to change without notice. All information should be independently reviewed and verified for accuracy. Properties may or may not be listed by the office/agent presenting the information. Some IDX listings have been excluded from this website. IDX information is provided exclusively for personal, non-commercial use, and may not be used for any purpose other than to identify prospective properties consumers may be interested in purchasing. Information is deemed reliable but not guaranteed.
Based on information submitted to the MLS GRID
Ask me questions while you tour the home.