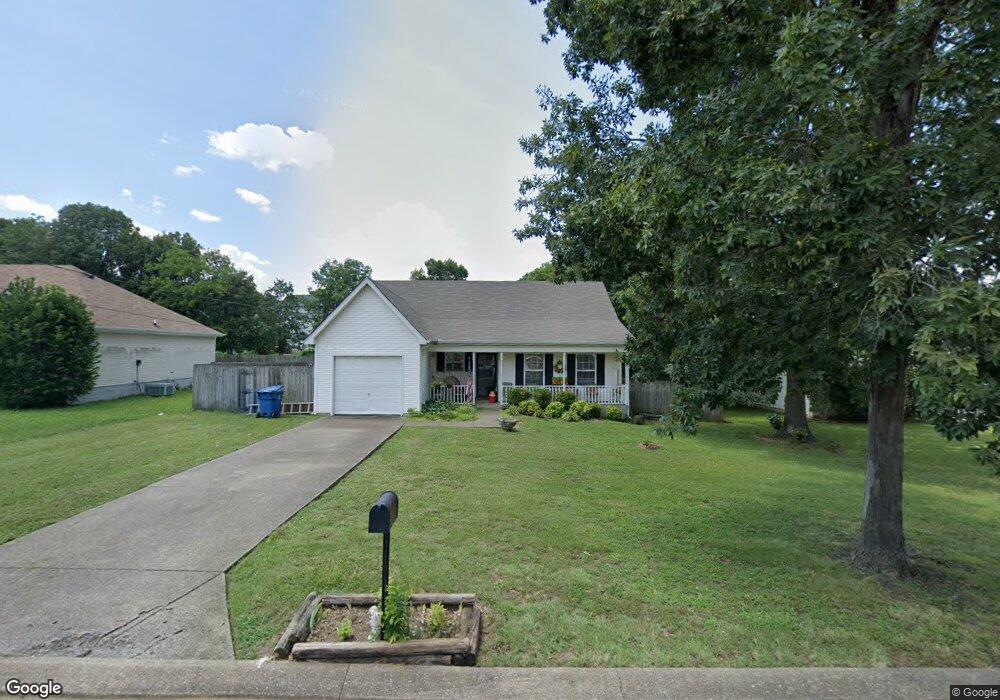
319 Pine Ridge Ln La Vergne, TN 37086
Estimated Value: $283,769 - $339,000
--
Bed
2
Baths
1,304
Sq Ft
$241/Sq Ft
Est. Value
About This Home
This home is located at 319 Pine Ridge Ln, La Vergne, TN 37086 and is currently estimated at $314,442, approximately $241 per square foot. 319 Pine Ridge Ln is a home located in Rutherford County with nearby schools including LaVergne Lake Elementary School, La Vergne Middle School, and Lavergne High School.
Ownership History
Date
Name
Owned For
Owner Type
Purchase Details
Closed on
Jul 22, 2008
Sold by
Frank Russell
Bought by
Marie Wilson Katherine
Current Estimated Value
Home Financials for this Owner
Home Financials are based on the most recent Mortgage that was taken out on this home.
Original Mortgage
$118,960
Outstanding Balance
$78,133
Interest Rate
6.43%
Estimated Equity
$236,309
Purchase Details
Closed on
Apr 17, 2008
Sold by
Mccullough Mitchell S
Bought by
Frank Russell
Purchase Details
Closed on
Mar 3, 2005
Sold by
Curtis Gary D
Bought by
Scott Mccllough Mitchell and Scott Deb
Home Financials for this Owner
Home Financials are based on the most recent Mortgage that was taken out on this home.
Original Mortgage
$94,720
Interest Rate
7.14%
Purchase Details
Closed on
Sep 28, 2001
Sold by
Kimberly Curtis
Bought by
Gary Curtis
Purchase Details
Closed on
Dec 27, 1999
Sold by
Continental Development
Bought by
Curtis Gary D and Curtis Kimberly
Create a Home Valuation Report for This Property
The Home Valuation Report is an in-depth analysis detailing your home's value as well as a comparison with similar homes in the area
Home Values in the Area
Average Home Value in this Area
Purchase History
| Date | Buyer | Sale Price | Title Company |
|---|---|---|---|
| Marie Wilson Katherine | $118,900 | -- | |
| Frank Russell | $87,000 | -- | |
| Scott Mccllough Mitchell | $118,400 | -- | |
| Gary Curtis | -- | -- | |
| Curtis Gary D | $116,900 | -- |
Source: Public Records
Mortgage History
| Date | Status | Borrower | Loan Amount |
|---|---|---|---|
| Open | Curtis Gary D | $118,960 | |
| Previous Owner | Curtis Gary D | $94,720 | |
| Previous Owner | Curtis Gary D | $23,680 |
Source: Public Records
Tax History Compared to Growth
Tax History
| Year | Tax Paid | Tax Assessment Tax Assessment Total Assessment is a certain percentage of the fair market value that is determined by local assessors to be the total taxable value of land and additions on the property. | Land | Improvement |
|---|---|---|---|---|
| 2025 | $1,492 | $61,825 | $13,750 | $48,075 |
| 2024 | $1,492 | $61,825 | $13,750 | $48,075 |
| 2023 | $1,160 | $61,825 | $13,750 | $48,075 |
| 2022 | $999 | $61,825 | $13,750 | $48,075 |
| 2021 | $980 | $44,175 | $10,000 | $34,175 |
| 2020 | $980 | $44,175 | $10,000 | $34,175 |
| 2019 | $980 | $44,175 | $10,000 | $34,175 |
| 2018 | $1,241 | $44,175 | $0 | $0 |
| 2017 | $1,005 | $27,675 | $0 | $0 |
| 2016 | $1,005 | $27,675 | $0 | $0 |
| 2015 | $1,012 | $27,675 | $0 | $0 |
| 2014 | $688 | $27,675 | $0 | $0 |
| 2013 | -- | $28,450 | $0 | $0 |
Source: Public Records
Map
Nearby Homes
- 101 Kalman Minuskin Blvd
- 699 Hollandale Rd
- 733 Hollandale Rd
- 507 Jerald Smith Ln
- 166 Oasis Dr
- 160 Oasis Dr
- 164 Oasis Dr
- 154 Oasis Dr
- 303 Amit St
- 618 Cedar Bend Ln
- 605 Hollandale Rd
- 514 Bon Aqua Dr
- 205 Clearlake Dr
- 603 Hollandale Rd
- 303 Holland Ridge Dr
- 800 Troy Cove
- 607 Mable Dr
- 1529 Waxman Dr
- 396 Davids Way
- 1610 Jo Ann Dr
- 317 Pine Ridge Ln
- 321 Pine Ridge Ln
- 406 Meagan Cove
- 315 Pine Ridge Ln
- 404 Meagan Cove
- 408 Meagan Cove
- 318 Pine Ridge Ln
- 316 Pine Ridge Ln
- 323 Pine Ridge Ln
- 320 Pine Ridge Ln
- 410 Meagan Cove
- 313 Pine Ridge Ln
- 402 Meagan Cove
- 314 Pine Ridge Ln
- 324 Pine Ridge Ln
- 322 Pine Ridge Ln
- 312 Pine Ridge Ln
- 311 Pine Ridge Ln
- 403 Meagan Cove
- 411 Meagan Cove