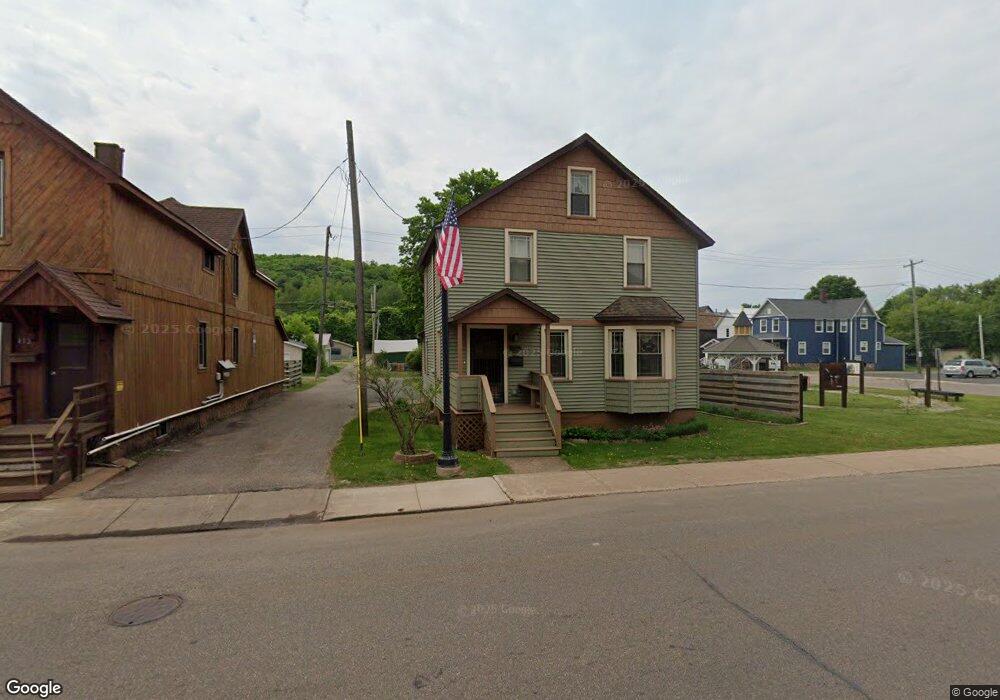
319 S 3rd St Ishpeming, MI 49849
Estimated Value: $57,901 - $186,000
2
Beds
--
Bath
1,000
Sq Ft
$122/Sq Ft
Est. Value
About This Home
Spacious, fully furnished two story apartment with living area, kitchen, and bathroom on the first floor and bedrooms and master bathroom on the second floor. Washer and dryer are in the unit. Water, gas, electric, trash removal, lawn care and snow removal are included. This is a smoke free building.
We do require a minimum annual income of $24,000 to qualify for this apartment.
Security deposit ($1400) and cleaning fee ($200) would be due at lease signing.
An application must be summited to schedule a viewing. All applications are due by September 15th.
Ownership History
Date
Name
Owned For
Owner Type
Purchase Details
Closed on
Feb 10, 2023
Sold by
James M Manty And Joann L Manty Trust
Bought by
Marshall Cote A
Current Estimated Value
Home Financials for this Owner
Home Financials are based on the most recent Mortgage that was taken out on this home.
Original Mortgage
$174,080
Outstanding Balance
$168,667
Interest Rate
6.38%
Mortgage Type
New Conventional
Estimated Equity
-$46,942
Create a Home Valuation Report for This Property
The Home Valuation Report is an in-depth analysis detailing your home's value as well as a comparison with similar homes in the area
Home Values in the Area
Average Home Value in this Area
Purchase History
| Date | Buyer | Sale Price | Title Company |
|---|---|---|---|
| Marshall Cote A | -- | -- |
Source: Public Records
Mortgage History
| Date | Status | Borrower | Loan Amount |
|---|---|---|---|
| Open | Marshall Cote A | $174,080 |
Source: Public Records
Property History
| Date | Event | Price | List to Sale | Price per Sq Ft |
|---|---|---|---|---|
| 10/31/2024 10/31/24 | Off Market | $1,400 | -- | -- |
| 10/08/2024 10/08/24 | Off Market | $1,400 | -- | -- |
| 10/01/2024 10/01/24 | For Rent | $1,400 | 0.0% | -- |
| 09/28/2024 09/28/24 | For Rent | $1,400 | -- | -- |
Tax History
| Year | Tax Paid | Tax Assessment Tax Assessment Total Assessment is a certain percentage of the fair market value that is determined by local assessors to be the total taxable value of land and additions on the property. | Land | Improvement |
|---|---|---|---|---|
| 2025 | $266 | $11,750 | $0 | $0 |
| 2024 | $3 | $11,100 | $0 | $0 |
| 2023 | $79 | $10,200 | $0 | $0 |
| 2022 | $480 | $7,250 | $0 | $0 |
| 2021 | $468 | $7,300 | $0 | $0 |
| 2020 | $459 | $7,250 | $0 | $0 |
| 2019 | $451 | $7,300 | $0 | $0 |
| 2018 | $439 | $8,500 | $0 | $0 |
| 2017 | $428 | $8,500 | $0 | $0 |
| 2016 | $416 | $7,000 | $0 | $0 |
| 2015 | -- | $7,000 | $0 | $0 |
| 2014 | -- | $7,200 | $0 | $0 |
| 2012 | -- | $6,300 | $0 | $0 |
Source: Public Records
Map
Nearby Homes
- 114 E Superior St
- 401 Cleveland Ave
- 113 N 2nd St
- 200 W Ridge St
- 312 W Ridge St
- 818 N Pine St
- 635 N 5th St
- 242 Hill St
- 408 E Empire St
- 258 Hill St
- 612 Maurice St
- TBD Us Highway 41
- 645 Palms Ave
- 162 Saginaw St
- 684 Mather Ave
- 2009 Deer Lake Ave
- 2115 Deer Lake Ave
- 208 Shoreline Dr
- 235 Balsam Ln
- 604 County Rd
Your Personal Tour Guide
Ask me questions while you tour the home.